Bitcoin, XRP and Cardano Price Analysis: July 28

The latest jump in the crypto market came right after Tesla’s June quarter earnings revealed that it still holds $1.3 billion worth of Bitcoin. Bitcoin surged to reach the $40,000 level. XRP flashed mounting buying pressure along with signs of increased volatility and lastly, ADA observed a dip in capital inflows at press time.
Bitcoin

BTC/USD, TradingView
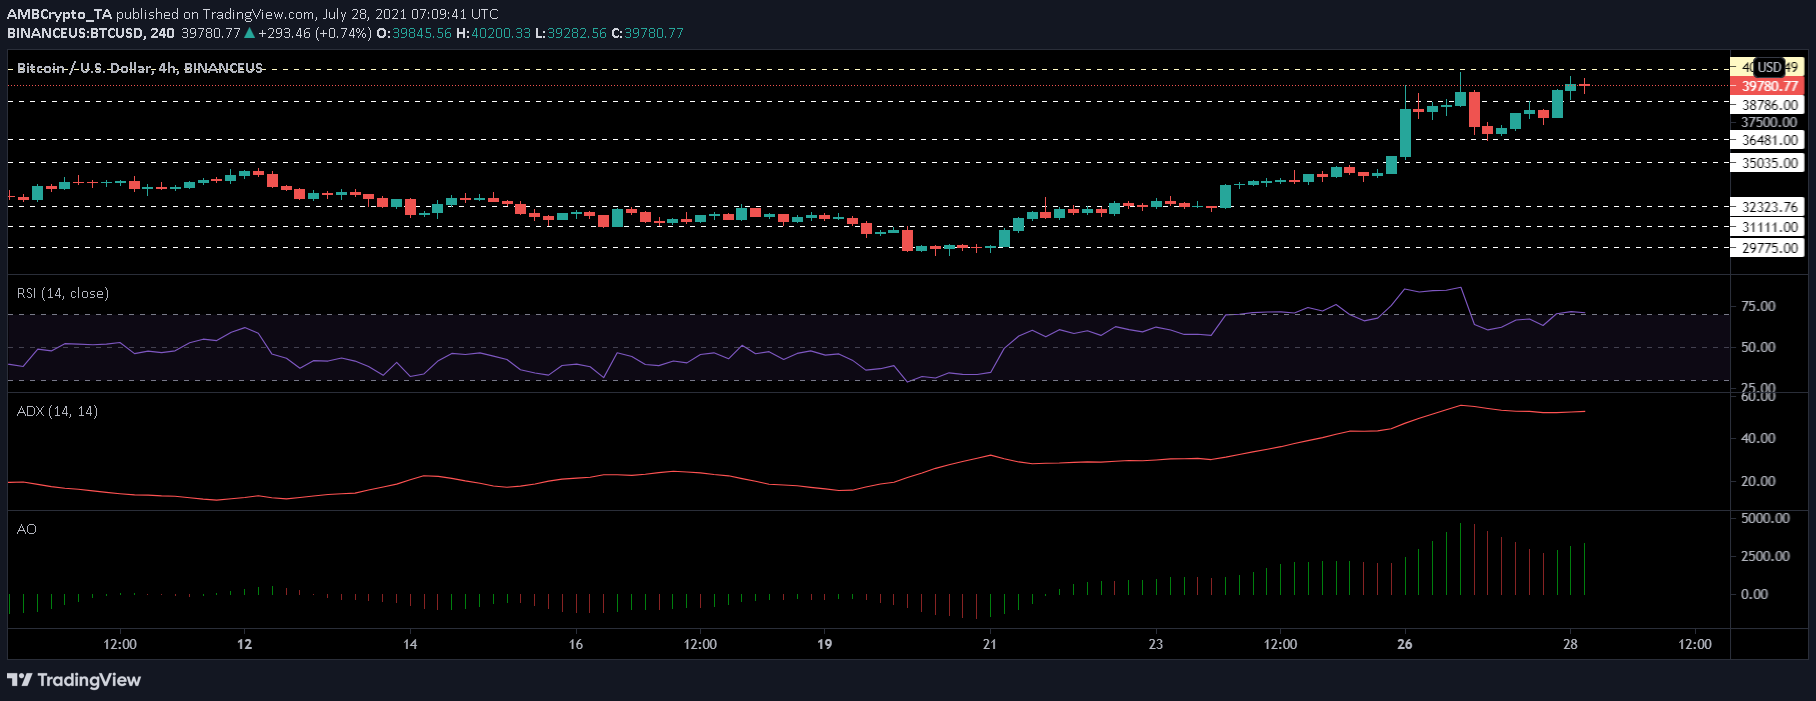
Bitcoin surged almost 7% and was hovering very close to the $40,000 mark. It has been a volatile few days for the cryptomarket with the big coins rallying and then dropping in value.
Conversely, Bitcoin’s trading volume dipped by 7.77% at press time, indicating that selling pressure in the market fell compared to yesterday. Buying pressure shot up with Bitcoin falling into the oversold and overbought territory. Relative Strength Index was seen above the 75-mark confirming the above statement.
Bitcoin rallied and tried to cross the $40,000 mark just a few days back too; prices moved around the same range for some time for the market trend to strengthen. Average Directional Index was pictured above 40-mark; a reading that signified a strengthening market trend.
Green signal bars on Awesome Oscillator also grew in size and number implying an onset of bullish strength.
XRP

XRP/USD, TradingView
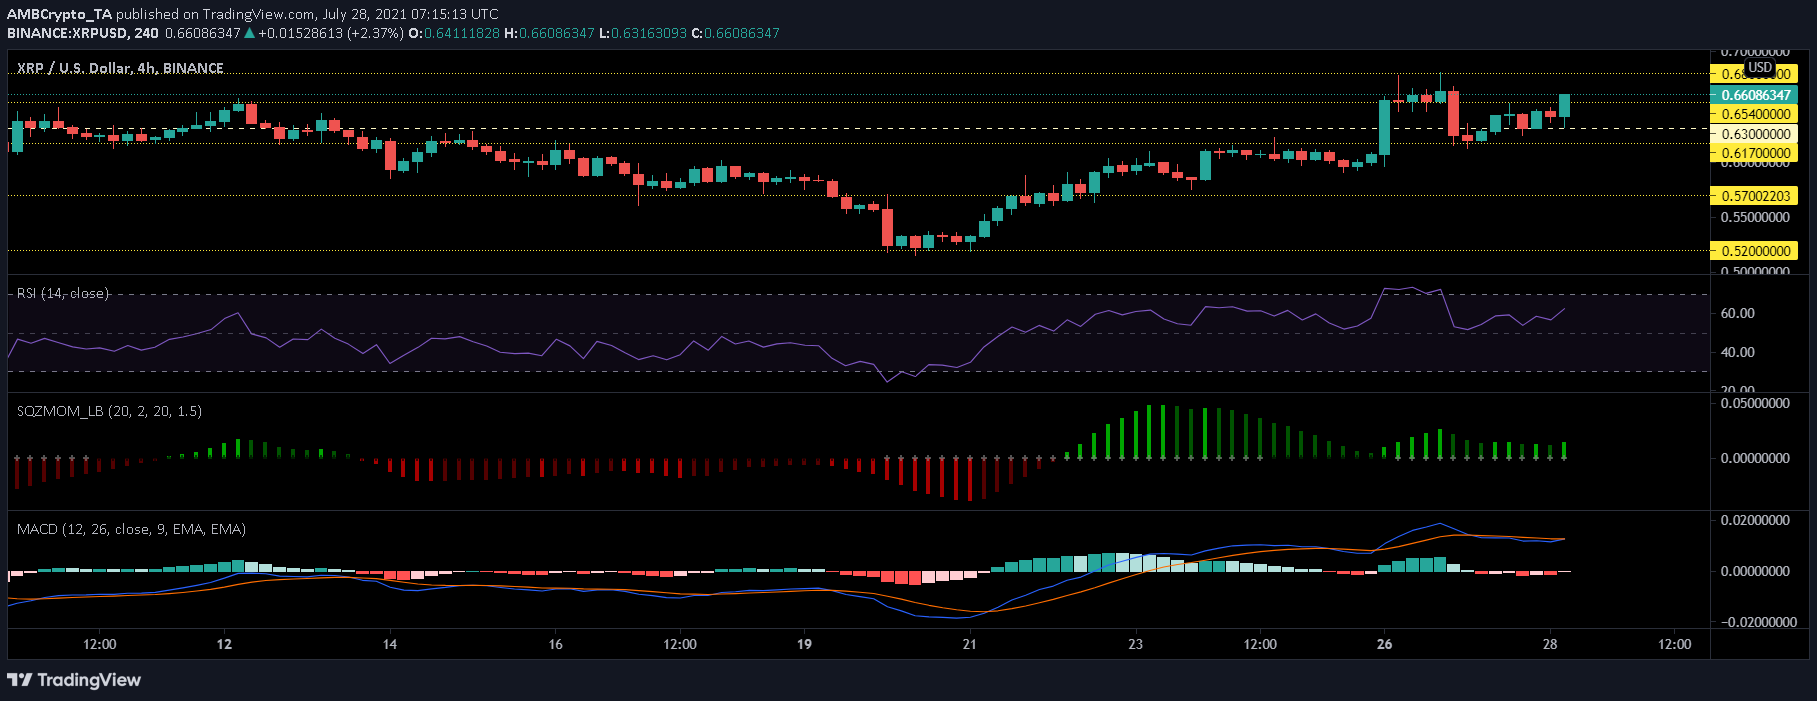
XRP recovered 11.7% of its lost value over the last 24 hours. The surge in price pushed its market capitalization by 6.96% and the 24-hour trading volume also shot up by 16.71%. XRP was priced at $0.66 at the time of writing.
Relative Strength Index showed a bullish trend; XRP fell back from the overbought zone; however, at the time of writing, the indicator registered a northward movement suggesting buyers preceding sellers.
With respect to volatility, Squeeze Momentum Indicator displayed a squeeze release, which meant that prices could fall and rise sharply over the upcoming trading sessions. It also depicted a decline in buy signal at press time.
MACD indicator flashed a bearish crossover on July 27 and red histograms displayed bearish signal.
Cardano

ADA/USD, TradingView
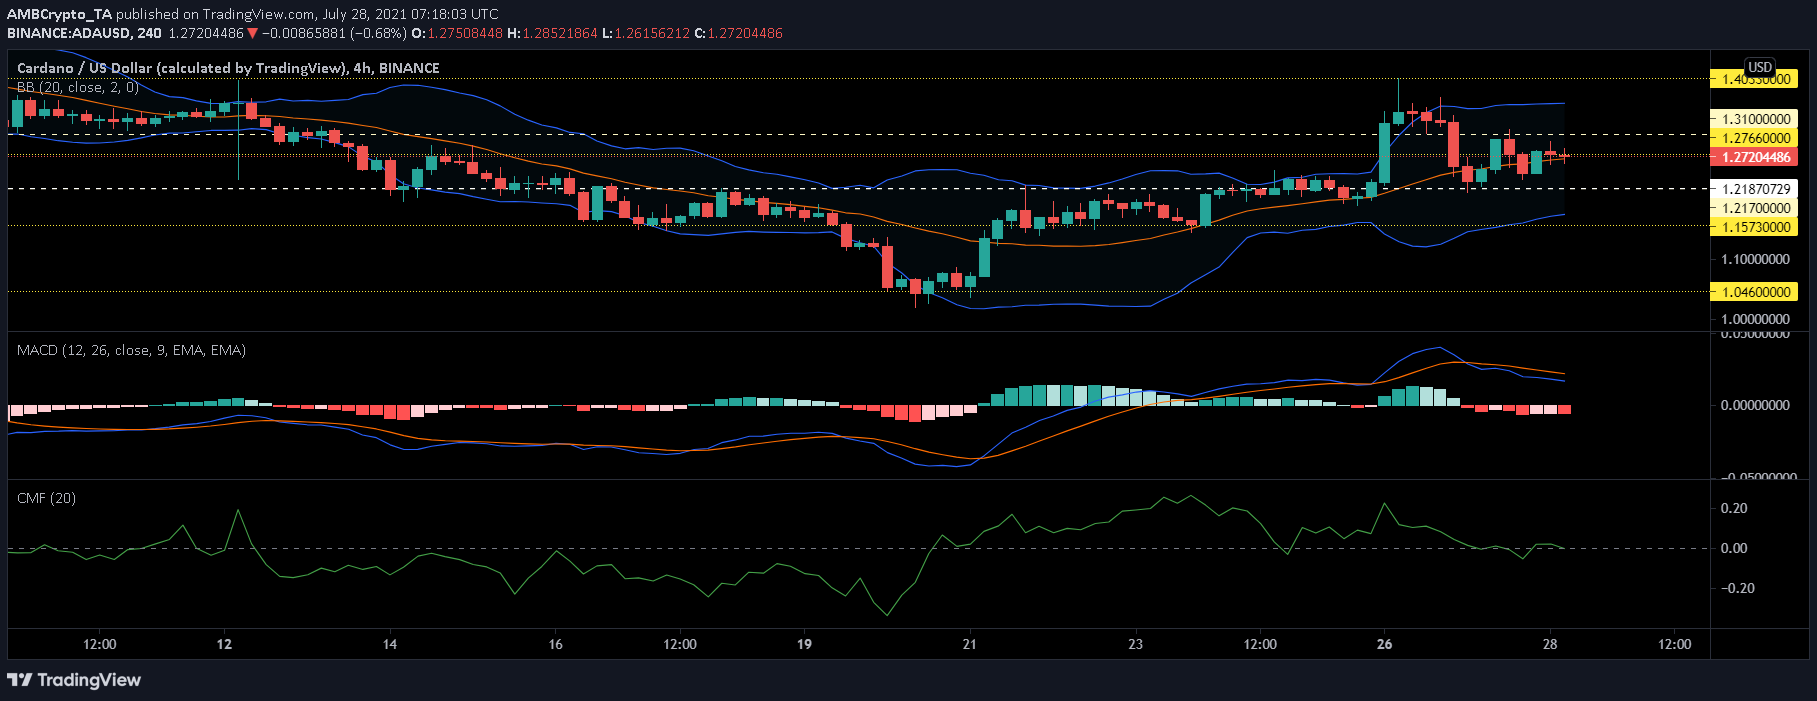
ADA stood at $1.27 over a 4.2% rise in the daily time frame. The coin rose by more than 22% over the last week and registered a 2.1% intraday gain.
Volatility seems to be still high as Bollinger Bands opened up significantly at press time. If prices move on the upside, the immediate resistance lies at $1.31 while the support lies at $1.21.
Despite the increase in prices, buying pressure did not show considerable upward movement, instead, Chaikin Money Flow pictured a slight dip, which meant a fall in capital inflows. Capital inflows might potentially rise with the upcoming trading sessions if the coin’s prices remained around the current level.
MACD still displayed the presence of bearish histograms however, the coin was progressing towards a bullish crossover.

![Solana [SOL] gains on Ethereum [ETH] but faces sell-off risks](https://ambcrypto.com/wp-content/uploads/2025/04/5B92B32E-5F8B-49F6-94A3-D0086EF6CCA2-400x240.webp)


