Bitcoin’s $16,920 hurdle tips the scales in favor of the bears, but…

Disclaimer: The information presented does not constitute financial, investment, trading, or other types of advice and is solely the writer’s opinion
- BTC was bullish on the three-hour chart despite intense selling pressure.
- It may break above the $16865.42 & $16890.15 hurdles and retest the $16920.27 level, but a break below $16836.09 would invalidate the trend.
Bitcoin [BTC] started the new year with a slight recovery, posting higher lows since 1 January. It rose from its low of $16,500 on 1 January to a high of $16,919 on 4 January, gaining over 2.5%.
However, further short-term gains could be undermined after BTC bulls encountered a crucial obstacle at this level.
Read Bitcoin’s [BTC] Price Prediction 2023-24
Bitcoin resistance at $16920: Can bulls overcome it or retest it?

BTC’s recent rally stopped after the price reached the late December bearish order block at around $16920.
The three-hour chart showed that the Relative Strength Index (RSI) was above the midpoint and approached the overbought zone. This suggested that buying pressure had increased recently and could give the bulls the momentum to overcome the immediate hurdles and retest the $16920.27 level.
However, the Money Flow Index (MFI) and the Chaikin Money Flow (CMF) had downticks, with the CMF falling below the zero mark. This showed that a distribution had taken place, and sellers gained slightly.
If sellers gained momentum, BTC would fall lower and retest $16836.09 before trying again to break the bearish order block.
However, if selling pressure intensified and pushed BTC below $16836.09, the bullish bias, inclined towards a retest of the bearish order block of $16920.27, would be invalid.
Such a downside move could see BTC drop to the seven-period exponential moving average (EMA) of $16787.60 or turn the former resistance at $16733.24 into support. These levels can serve as targets for short-selling if BTC falls lower.
BTC’s Open Interest remained relatively constant despite the rising price
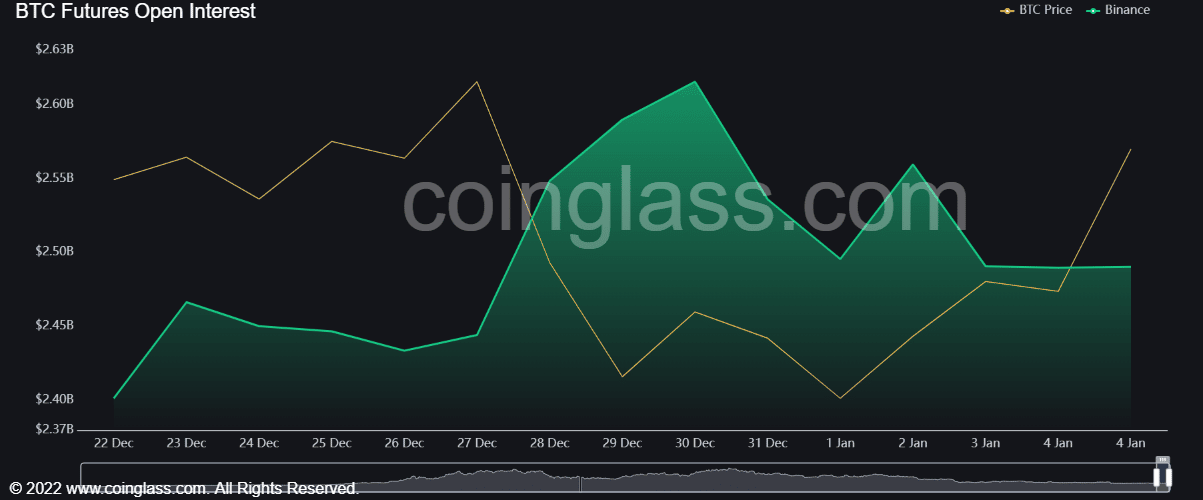
The recent rise in BTC prices has not affected the number of open short or long positions (open interest) on the Binance exchange. The open interest (OI) remained relatively flat despite the rising prices, i.e., an OI/price divergence.
A similar trend (rising BTC price with falling OI) on 24 December was followed by a short-term decline in BTC prices. On the other hand, an increase in OI around 27 and 28 December corresponded with a decrease in BTC prices, which was followed by a short-term increase in BTC prices.
Are your BTC holdings flashing red or green? Check with Profit Calculator
If the divergence trend repeats, could the price of Bitcoin fall in the short term? Could it reach the $16836.09 level again or fall below it?
The OI on other exchanges also remained relatively flat at press time.


