Bitcoin’s descending channel suggests positive break, but Death-cross raises doubts

Over the past 12 hours, Bitcoin’s price surged over 4 percent, taking its valuation back above $9000; after a quick correction, the price was back under the $9000 mark after depreciating about 3 percent over the past 4 hours. Volatility has been at its peak for BTC over the last few weeks.
Bitcoin dropped down to as low as $7356 on 24th October, but on the following day, the coin surprised the community after it hiked over 40 percent to breach $10,000 yet again. The price was quickly under $10,000 but it continued to consolidate higher in the charts. At press time, Bitcoin was valued at $8845.

Source: Coinstats
1-day chart

BTC/USD on Trading View
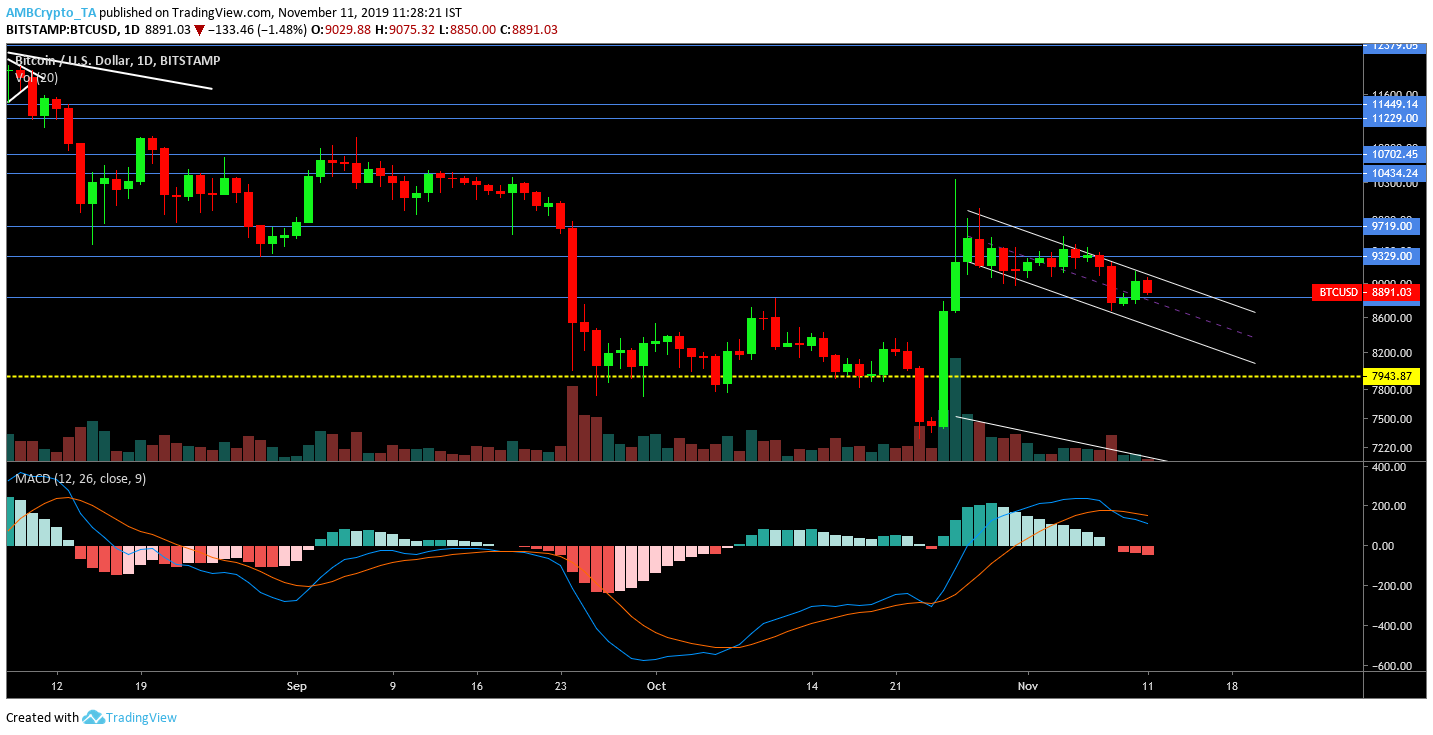
The decline on 24th September and the hike on 25th October were fairly evident in the 1-day chart. Between this period, Bitcoin strictly consolidated between $8829 and $7943 but before the rise on 25th, there was a steep decline witnessed on 23rd October. It was indicated that this period may have provided the window for accumulation.
The current price movement of Bitcoin exhibited formation of a descending channel. The pattern suggested that despite recent corrections, another bullish breakout was on the cards for Bitcoin. The immediate resistance for Bitcoin was placed at $9329 and $9719. BTC was able to breach both of these resistances last time around, but it failed to meet the resistance at $10434.
The decreasing trade volume indicated validity of the forming pattern.
12-hour chart

BTC/USD on Trading View
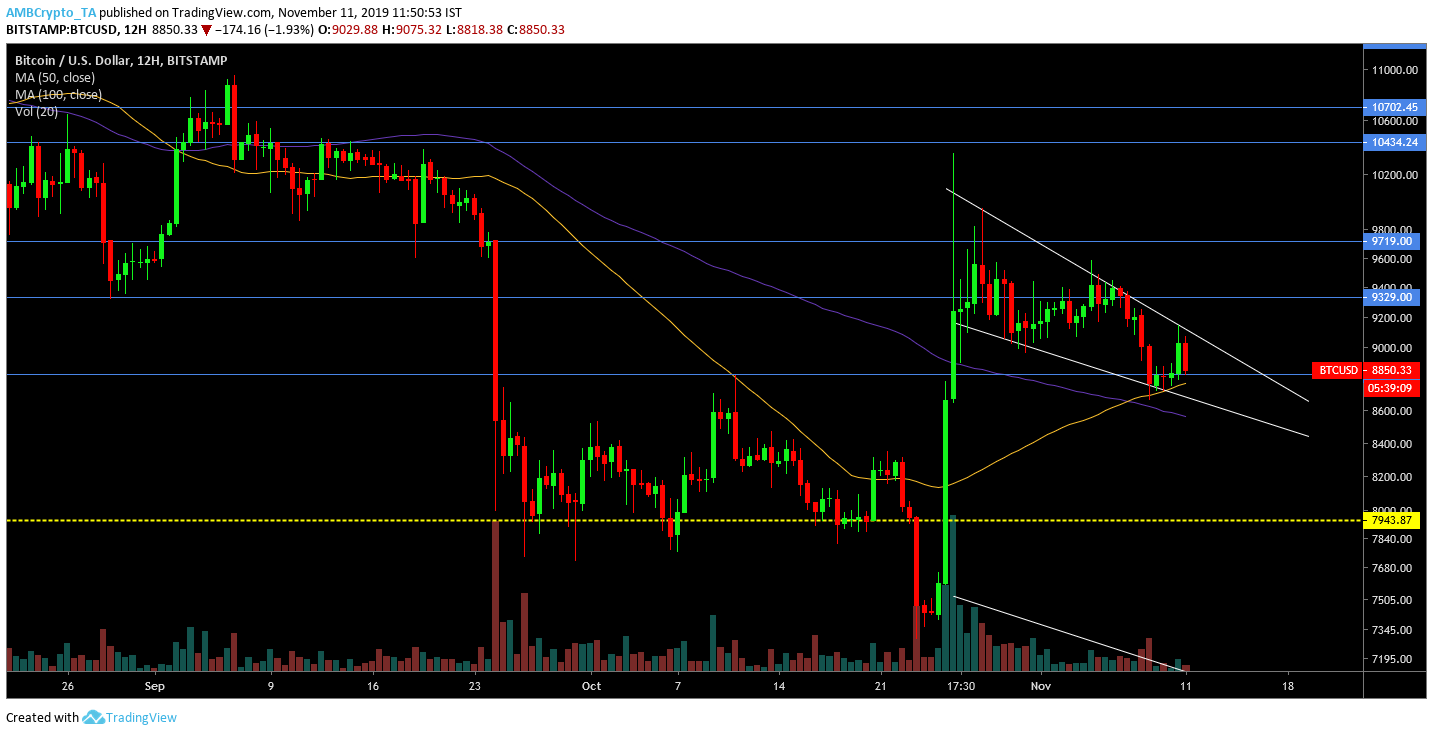
In a similar manner, the 12-hour chart of Bitcoin conveyed possibility of a bullish breakout for the largest digital asset. Further analysis also exhibited a falling wedge which increased the possibility of a positive break as well. The resistances were marked at identical spots for the 12-hour chart.
50-Moving Average also completed a bullish crossover with the 100-Moving Average and the decreasing trading volume also confirmed the falling wedge pattern.
Death Cross Alert?

BTC/USD on Trading View
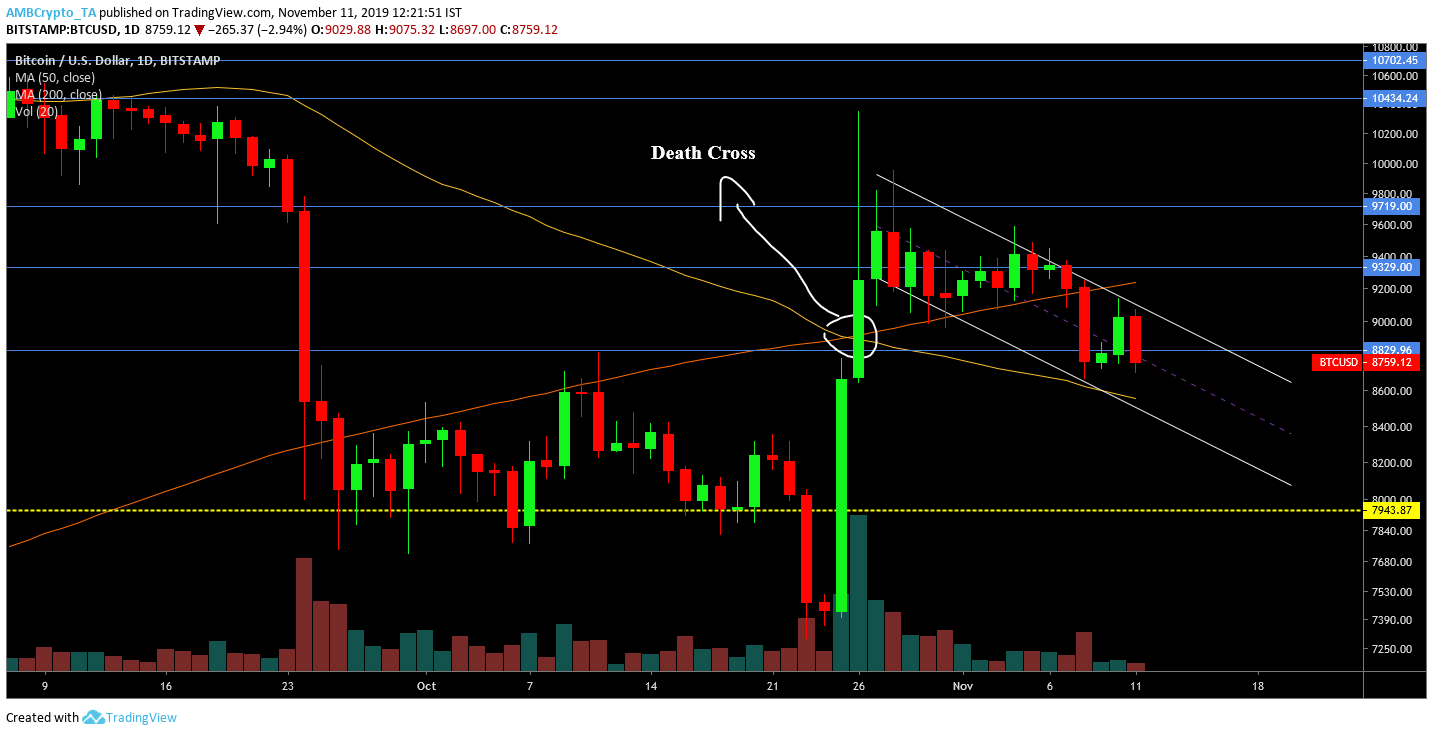
Despite all measures indicating an imminent bullish break, a major indicator may play a key role in BTC’s future valuation. Upon observation of the 1-day chart, 50-Moving Average completed an unasked death crossover with the 200-Moving Average. Coincidently, the crossover was completed on 25th October as well, and at press time, there were no signs of convergence between the indicators.
Taking the death cross into consideration, Bitcoin’s immediate valuation could swing either way. Though signs indicated toward a positive break, a looming death-cross may play spoilsport to the king coin’s ascent.


