Bitcoin’s price and how U.S, Asian trading sessions affect it

Unlike the stock market, Bitcoin and the larger cryptocurrency market trade 24 hours a day. However, while investors can trade at any time, the price action isn’t equal or uniform at all times of the day. There are periods of high volatility followed by little or no price action. This process takes place every day, forming a cycle. Identifying these zones, periods, and time ranges can assist in creating a trading strategy that could yield higher returns or mitigate risks.
Consider this – A popular belief in the cryptocurrency ecosystem is that the Asian trading zone is usually bearish and the U.S/European trading zone is bullish.
https://twitter.com/TheCryptoDog/status/1317849900659298306
https://twitter.com/AltcoinPsycho/status/1350705185761456129
Now, before getting into the minutiae of Crypto-Twitter’s ” U.S pump, Asia dump” belief, let’s try to understand the trading zones and why/how they affect the price and if this holds true for the cryptocurrency market and more specifically, Bitcoin.
The 3-session system
According to Investopedia,
“… the market is separated into three peak activity sessions: the Asian, European, and North American sessions… These names are used interchangeably, as the three cities represent the major financial centers for each of the regions. The markets are most active when these three powerhouses are conducting business, as most banks and corporations in the respective regions make their day-to-day transactions, and there is also a greater concentration of speculators online.”
The Asian session typically opens at 23:00 GMT and closes at 7:00 GMT, while the European session ranges between 07:00 GMT and 15:00 GMT. The U.S session starts mid-way between the European session at 12:00 GMT and ends at 19:00 GMT.
Methodology
- For the purpose of this article, 24-hours were divided into 3 sessions – the Asian Session [23:00 GMT to 07:00 GMT] the U.S or the West Session [08:00 GMT to 19:00 GMT], and the Lull Session [20:00 GMT to 22:00 GMT]
- To study the effects of these zones on Bitcoin’s price, hourly price data starting from 2019 to 21 January 2021 was collected from Bitstamp exchange and then separated based on the aforementioned timezones
- Returns were calculated based on segregated price data
Results
Between 01 January 2019 and 21 January 2021, the U.S session registered average hourly returns of 0.25% whereas the Asian session had average returns of -0.08%. Clearly, CT’s belief is true. In fact, it was observed that the Asian session sells or takes profits, resulting in negative returns for that timezone.
In 2019, the Asian session returned -0.08% in returns while the U.S session recorded returns of 0.19%. This trend continued throughout 2020 as the U.S session accrued whopping hourly returns of 0.31% while the returns of the Asian session remained more or less the same.

The Lull Period
While the aforementioned results are conclusive, they are adulterated since they include a period where there isn’t a lot of trading activity. This period is called the “Lull period” and ranges between 20:00 GMT and 22:00 GMT. Separating these from the above results would give a clearer picture of the price returns based on the trading zones.
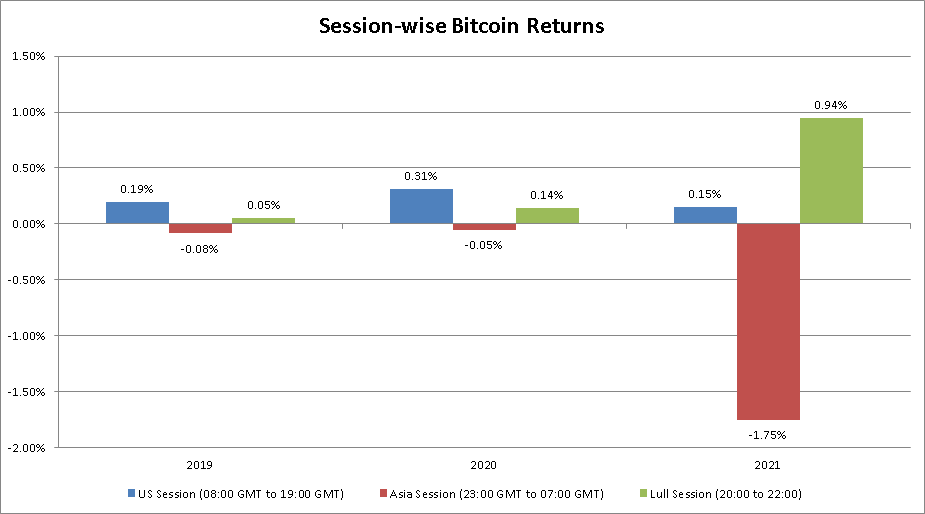
In 2019, the Lull period registered minute returns of 0.05%, but the same rose to 0.14% in 2020, with the same standing at 0.94% in 2021. As seen in the image attached above, not a lot of variation was observed in the Asian and the U.S sessions for 2019 and 2020.
However, the same cannot be said for 2021, especially considering Bitcoin’s latest price drop on 21 January, one which resulted in BTC retesting the yearly open at $28,956. While this may seem like a lot, these returns will be averaged out as 2021 progresses. Hence, ignoring the 2021 results, it can be seen that the Asian session has gotten bullish over the 2 years. Perhaps, the upcoming bull run will turn Asian traders into bulls.
Session-wise, quarterly returns showed that U.S sessions noted positive returns in each quarter of 2019 and 2020, with the exception of 2Q19. The Asian session, on the other hand, always registered negative returns in each quarter for the same time period, except in 2Q19.

Conclusion
This experiment proves that the price of Bitcoin varies as per the timezones. The price tends to drop quite a lot in the Asian session that ranges from 23:00 GMT to 07:00 GMT due to traders taking profits. Another reason why this trend exists is perhaps due to the concentration of Bitcoin miners in the east.
Miners need to support their operations, which, in this case, requires them to sell their Bitcoin holdings. Miners in the U.S, however, are relatively few, when compared to the East. Hence, the U.S session doesn’t see a lot of selling, explaining the positive returns.
Another interesting observation that can be made here are the price returns for the Lull period. In 2019, the Lull period returned an average of 0.05%, but this rose to 0.14% in 2020, a 180% year-on-year increase. Perhaps, adjusting trading strategies based on these evolving narratives would give traders an edge over the general market.


