Bitcoin’s ‘rally’ and the case for caution being an investor’s best friend

While Bitcoin’s price has been under the cosh over the past month, it has begun to consolidate lately. This coiling-up is likely to result in a minor downtrend before establishing a directional bias. Investors need to be cautious since two major on-chain metrics suggest that this move could be a bull trap that could knock BTC down.
A pullback in the making?
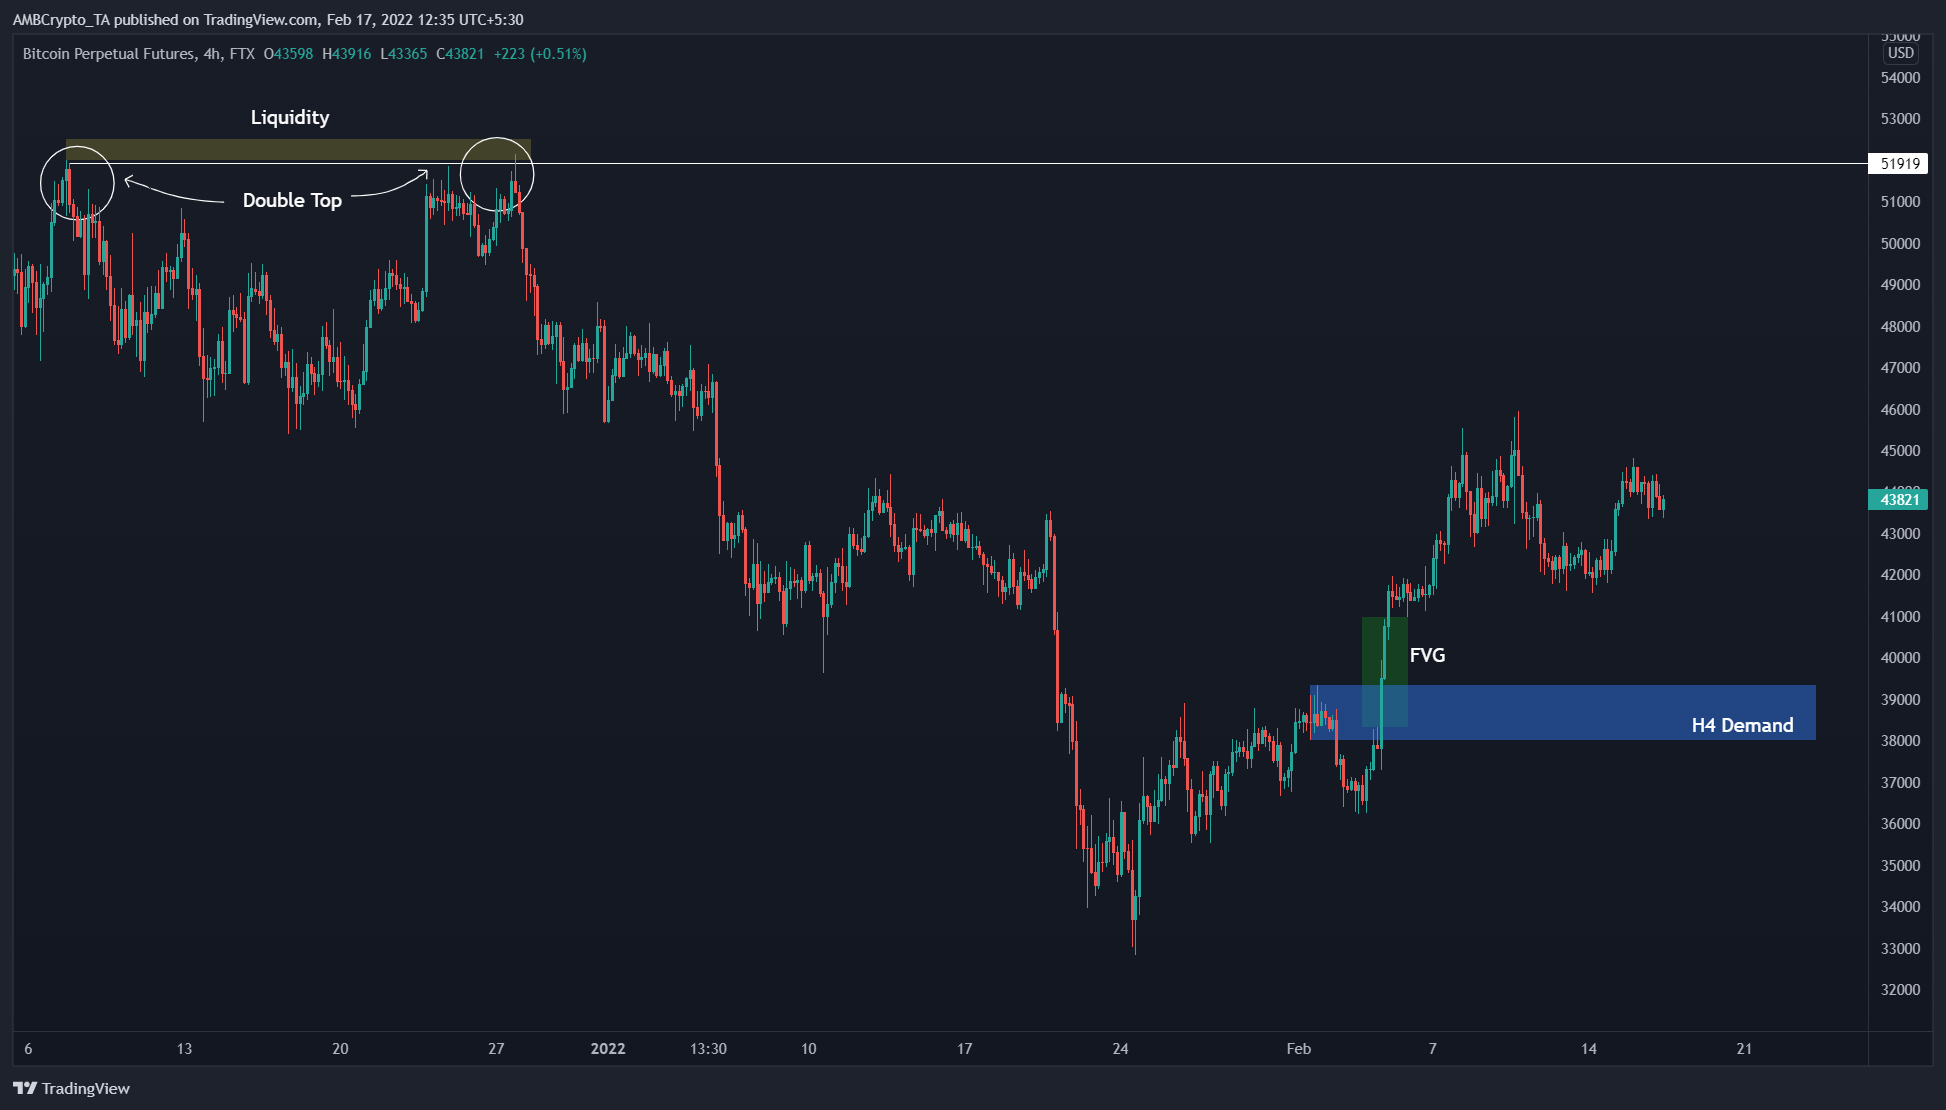
Bitcoin’s price action fueled an inefficiency known as the Fair Value Gap (FVG) as it rallied by 15% between 3-5 February. This gap is eventually invalidated as the asset trades lower and fills it up. Therefore, the run-up that is currently hovering around $43,835 is likely to retrace lower in a few days.
Moreover, the presence of the four-hour demand zone, extending from $38,006 to $39,332, suggests that this pullback is likely capped at $38,000.
Further supporting this downswing is the decline in the number of BTC held by Grayscale Investments from 644,000 to 643,000 since 18 January. This is a sign of institutions or high net-worth individuals offloading their investments.
Now, by itself, this might not seem like something to be concerned about. However, combining this with the data from CME reveals the bigger picture.
Not quite the entire picture
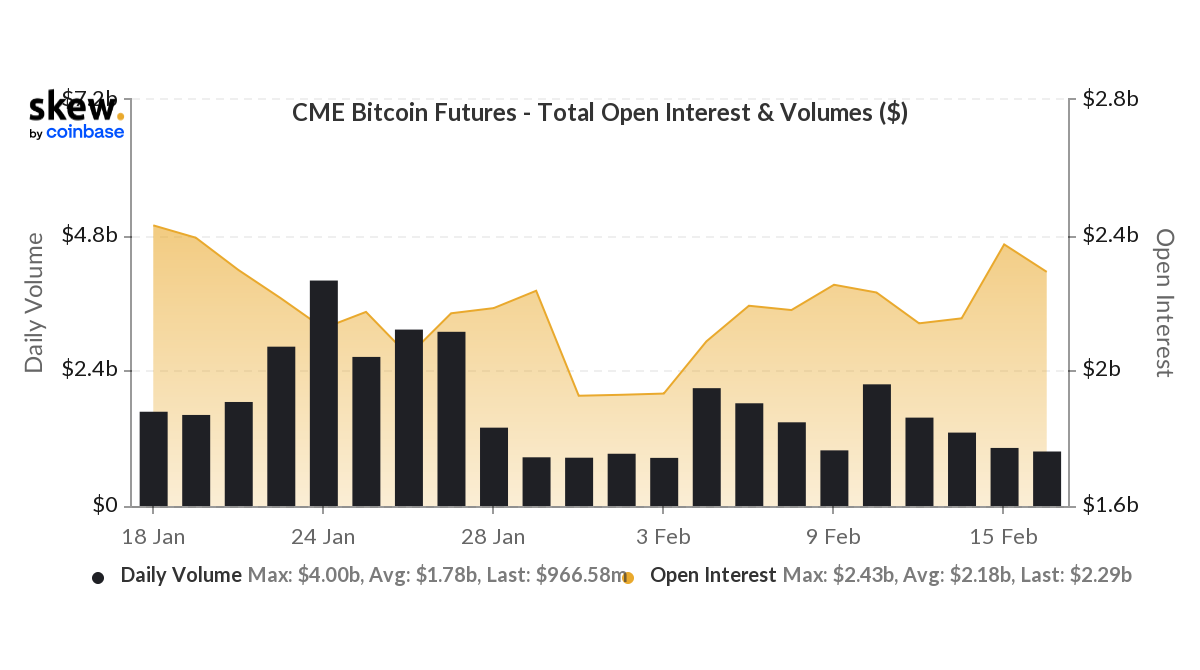
According to the CME’s data, the Open Interest for BTC has increased by 5.33% since 10 February from $2.25 billion to $2.37 billion. However, on the contrary, the volume declined by 55.27% within the same period, indicating that the market is over-leveraged.
Therefore, a short-term spike in selling pressure is likely to trigger a quick sell-off. Interestingly, this outlook coincides with the one from a technical perspective.
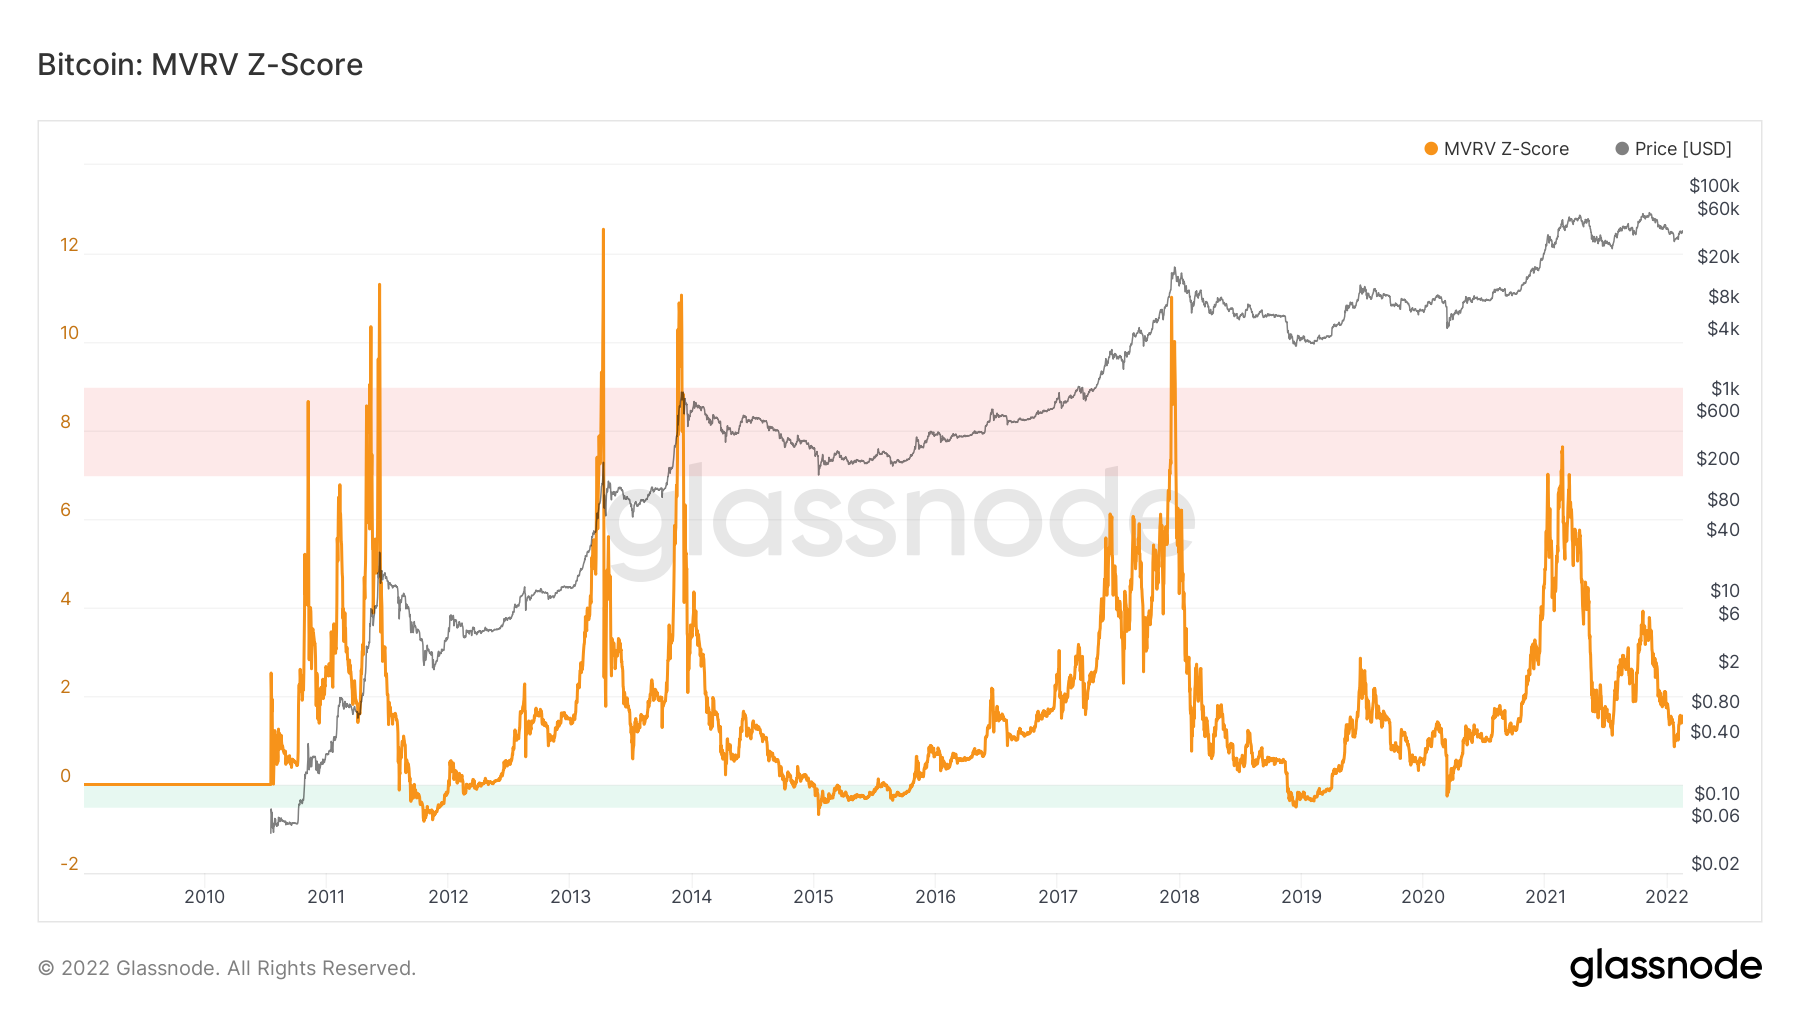
The Market Value to Realized Value MVRV Z-score indicator puts the final nail in the coffin for Bitcoin’s price. Especially since at press time, it hinted at the likelihood of a further move south. This on-chain indicator is used to determine if the BTC is oversold, fairly valued, or overbought.
The green and red bands have historically marked the cycle top and bottom, respectively. At the time of writing, the MVRV Z-score was hovering around 1.53, well above the red band. This indicates that a sell-off will likely push this value into the red band, marking the bottom of the long-term downtrend.
Therefore, investors need to be cautious as BTC’s price does not seem to have bottomed and a short-term downward move could be around the corner. If this outlook comes into play, altcoins will also feel the brunt of the sell-off and are likely to face a similar fate. Hence, market participants need to be cautious of a weekend sell-off.