This is where AVAX is headed in the next seven days

Disclaimer: The findings of the following analysis are the sole opinions of the writer and should not be considered investment advice
Avalanche has been bullish on the charts on lower timeframes since late January when it repeatedly knocked on the $73 resistance level before breaking above it. On a longer-term outlook, Avalanche has looked weak since mid-December. Yet, there were signs on the chart that the next few weeks could continue to be bullish. Could AVAX continue its rise toward $106, and possibly beyond?
AVAX- 12H
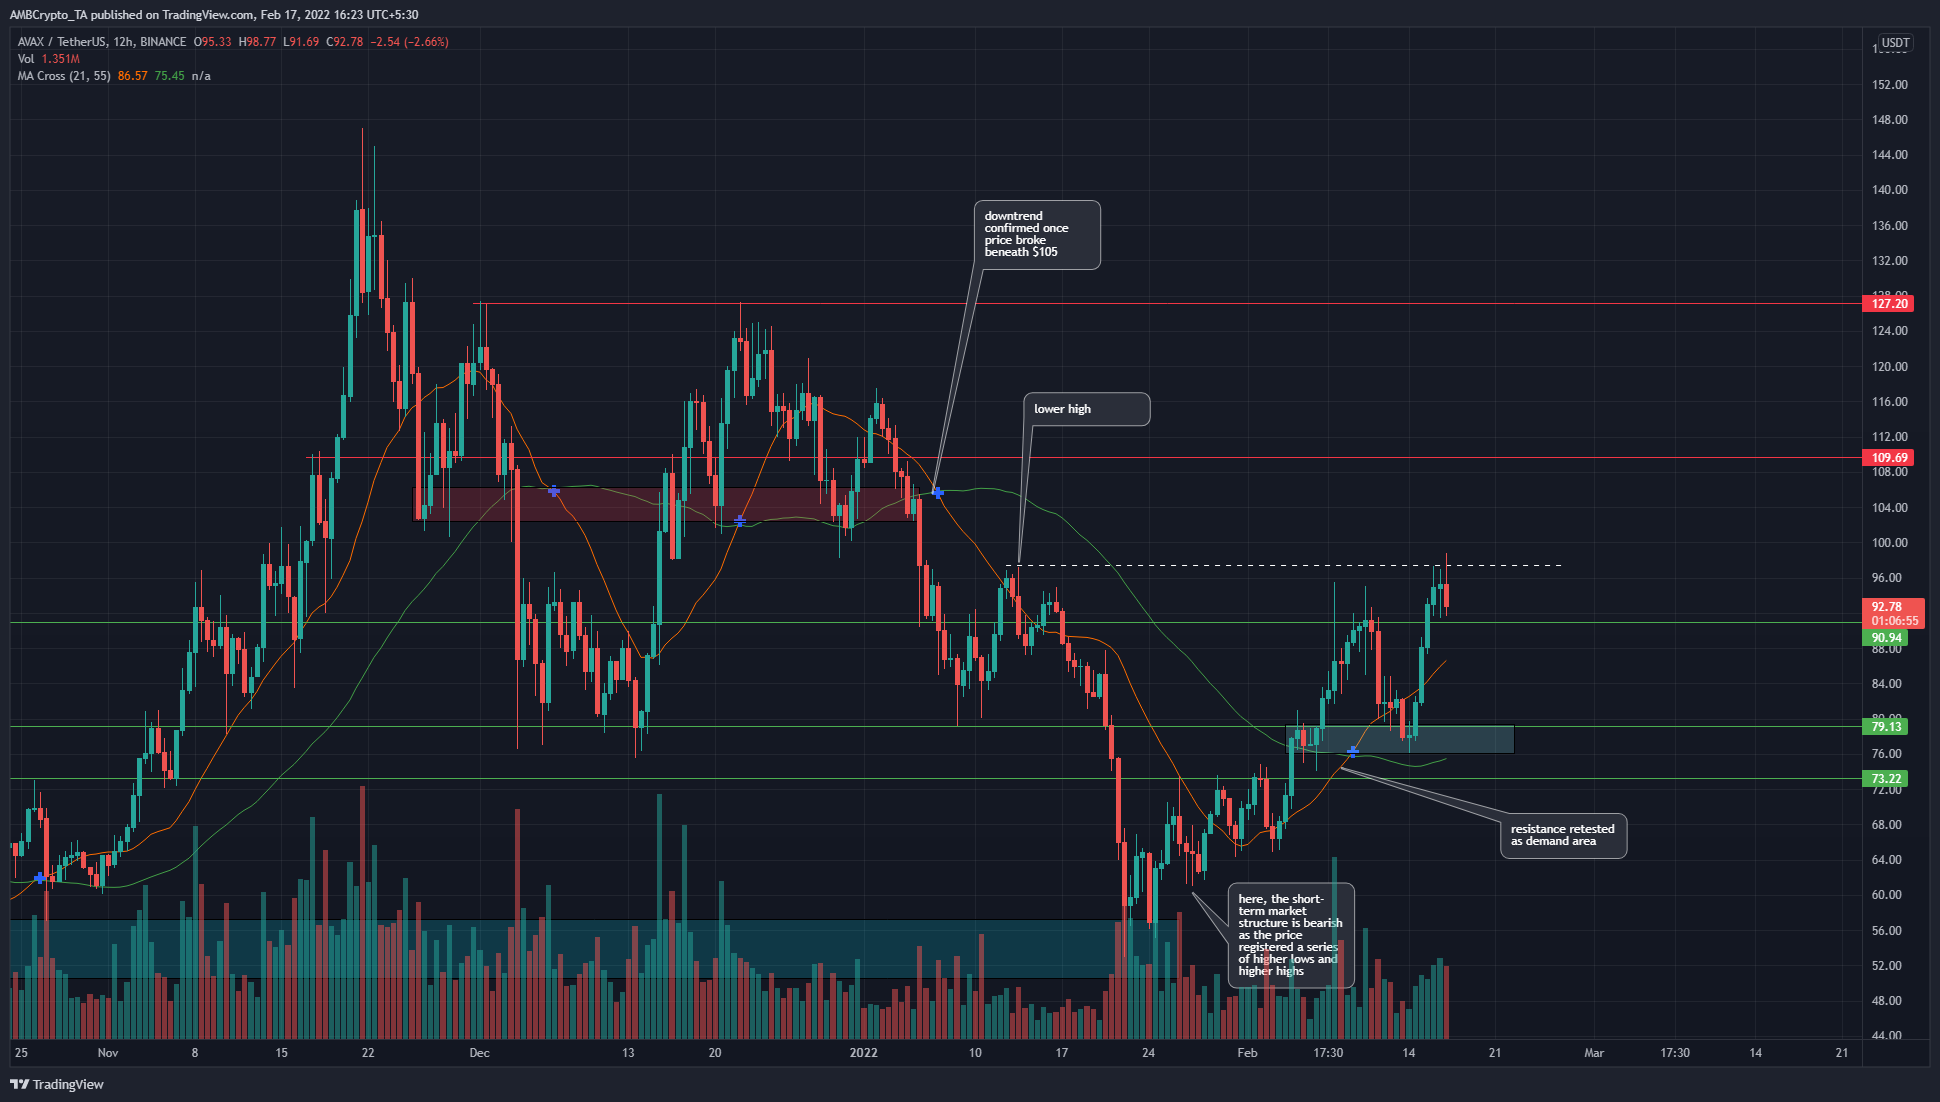
In mid-December, AVAX retested the $104 area (red box) in search of demand, bounced weakly to the $116 level, and plummeted below the support level once. This market entered a bearish trend that went on till late January- early February.
However, since the bounce in price from the $56 area (cyan box), and the subsequent move past the $73 level of former resistance, it appeared that AVAX might be on the path of establishing an uptrend that could last for a few weeks.
AVAX climbed to $90, retested $79 in search of buyers, and has once again climbed past the $90 level. A session close above the $97.4 level, which has been a level where AVAX marked a lower high on its way down, would be a bullish sign.
Rationale
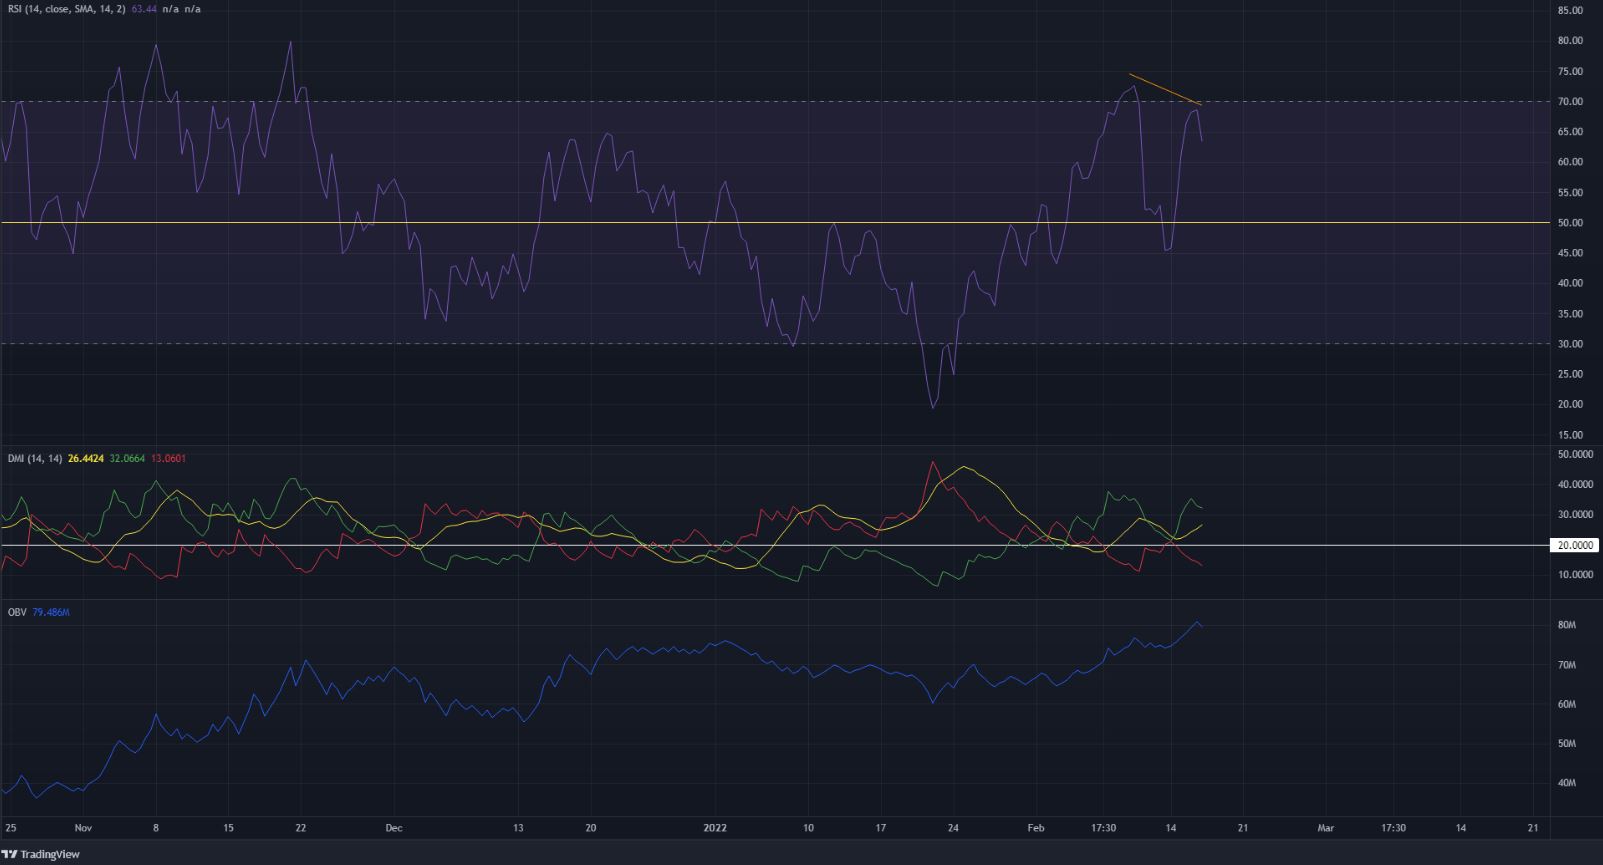
The RSI made a lower high (orange) while the price made a higher high in the same time period. This bearish divergence came just as AVAX tried to break above the $97 level (dotted white). Despite the divergence, it was unlikely that AVAX would drop too far south. $90.8 or $88 were likely levels where bullish momentum could resume again.
The Directional Movement Index showed that the past ten days have seen a strong bullish trend for AVAX, with the ADX (yellow) and +DI (green) both above the 20 value.
The OBV has also been on an uptrend in the past three weeks, which showed that demand was present behind AVAX’s rally.
The 21 SMA (orange) has also crossed over above the 55 SMA (green), which was another sign of bullish momentum on the rise.
Conclusion
The indicators of momentum and volume showed steady bullishness, while the market structure appeared to lean toward the side of the bulls, although the $97 would add strength to this bullish case. To the upside, the $104-$106 area offered resistance, with $109 and $127 also being levels to watch out for.