Bitcoin’s thorough on-chain analysis to help you sail through ennui

Bitcoin [BTC] is in the news, and things seemed to have gone awry once again. Following a momentary rally in July, BTC witnessed a decline in network activity that has culminated in a series of sell-offs in the last 22 days, as per Glassnode’s report.
When Bitcoin [BTC] registered its all-time high of $68,789.63 on 10 November 2021, little did investors know that the dreams of “wen $100k?” for the king coin would be thwarted upon entering into the new year.
In the first half of 2022, the price of BTC had gone down by over 60%. The number one cryptocurrency closed H1 at the $18,000 price region.
July, however, ushered in a brief period of relief for BTC holders. The coin traded above the realized price for 23 consecutive days.
Moreover, within the 31-day period, its price had grown by over 15%, according to data from CoinMarketCap.
Who let the bears out?
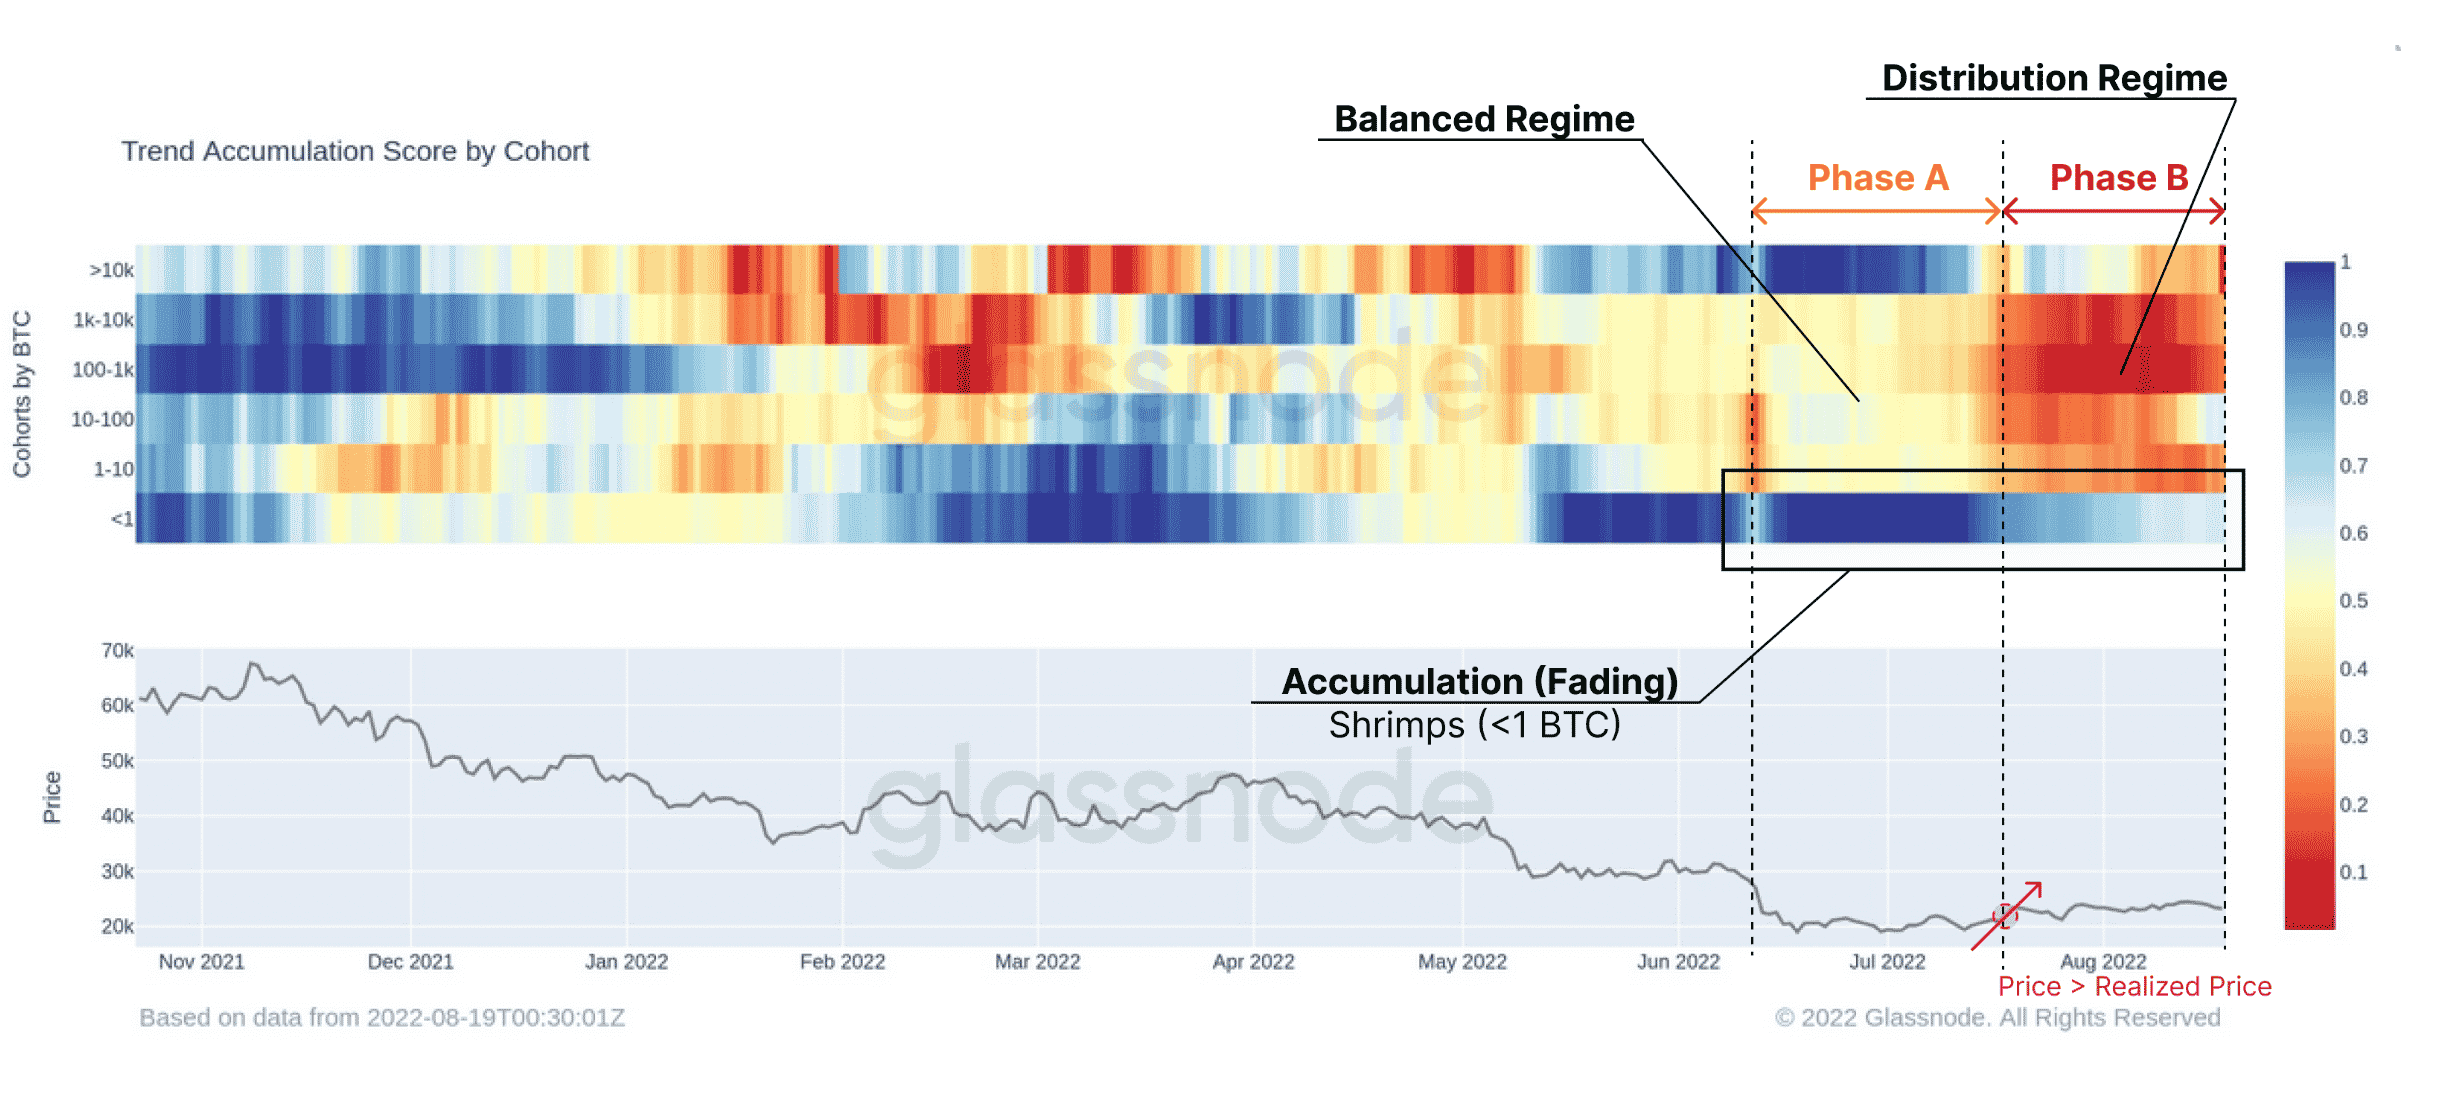
According to the report, Glassnode found that the current BTC market is in a distribution phase. Therefore, the analytics firm examined the Trend Accumulation Score by Cohort to understand how holders have accumulated and distributed the coin.
Glassnode found that after BTC crashed below $20,000, investors with less than one BTC and whales with over 10,000 BTC (excluding exchanges and miners) accumulated the cryptocurrency.
When BTC reclaimed its realized price, these holders embraced the opportunity to make a profit as they distributed their coins. This was coupled with the fact that the persistence of holders of less than one BTC was starting to wane.
The recent price uptick by the king coin “triggered a distribution phase across the board, adding sell pressure to the market,” Glassnode found.
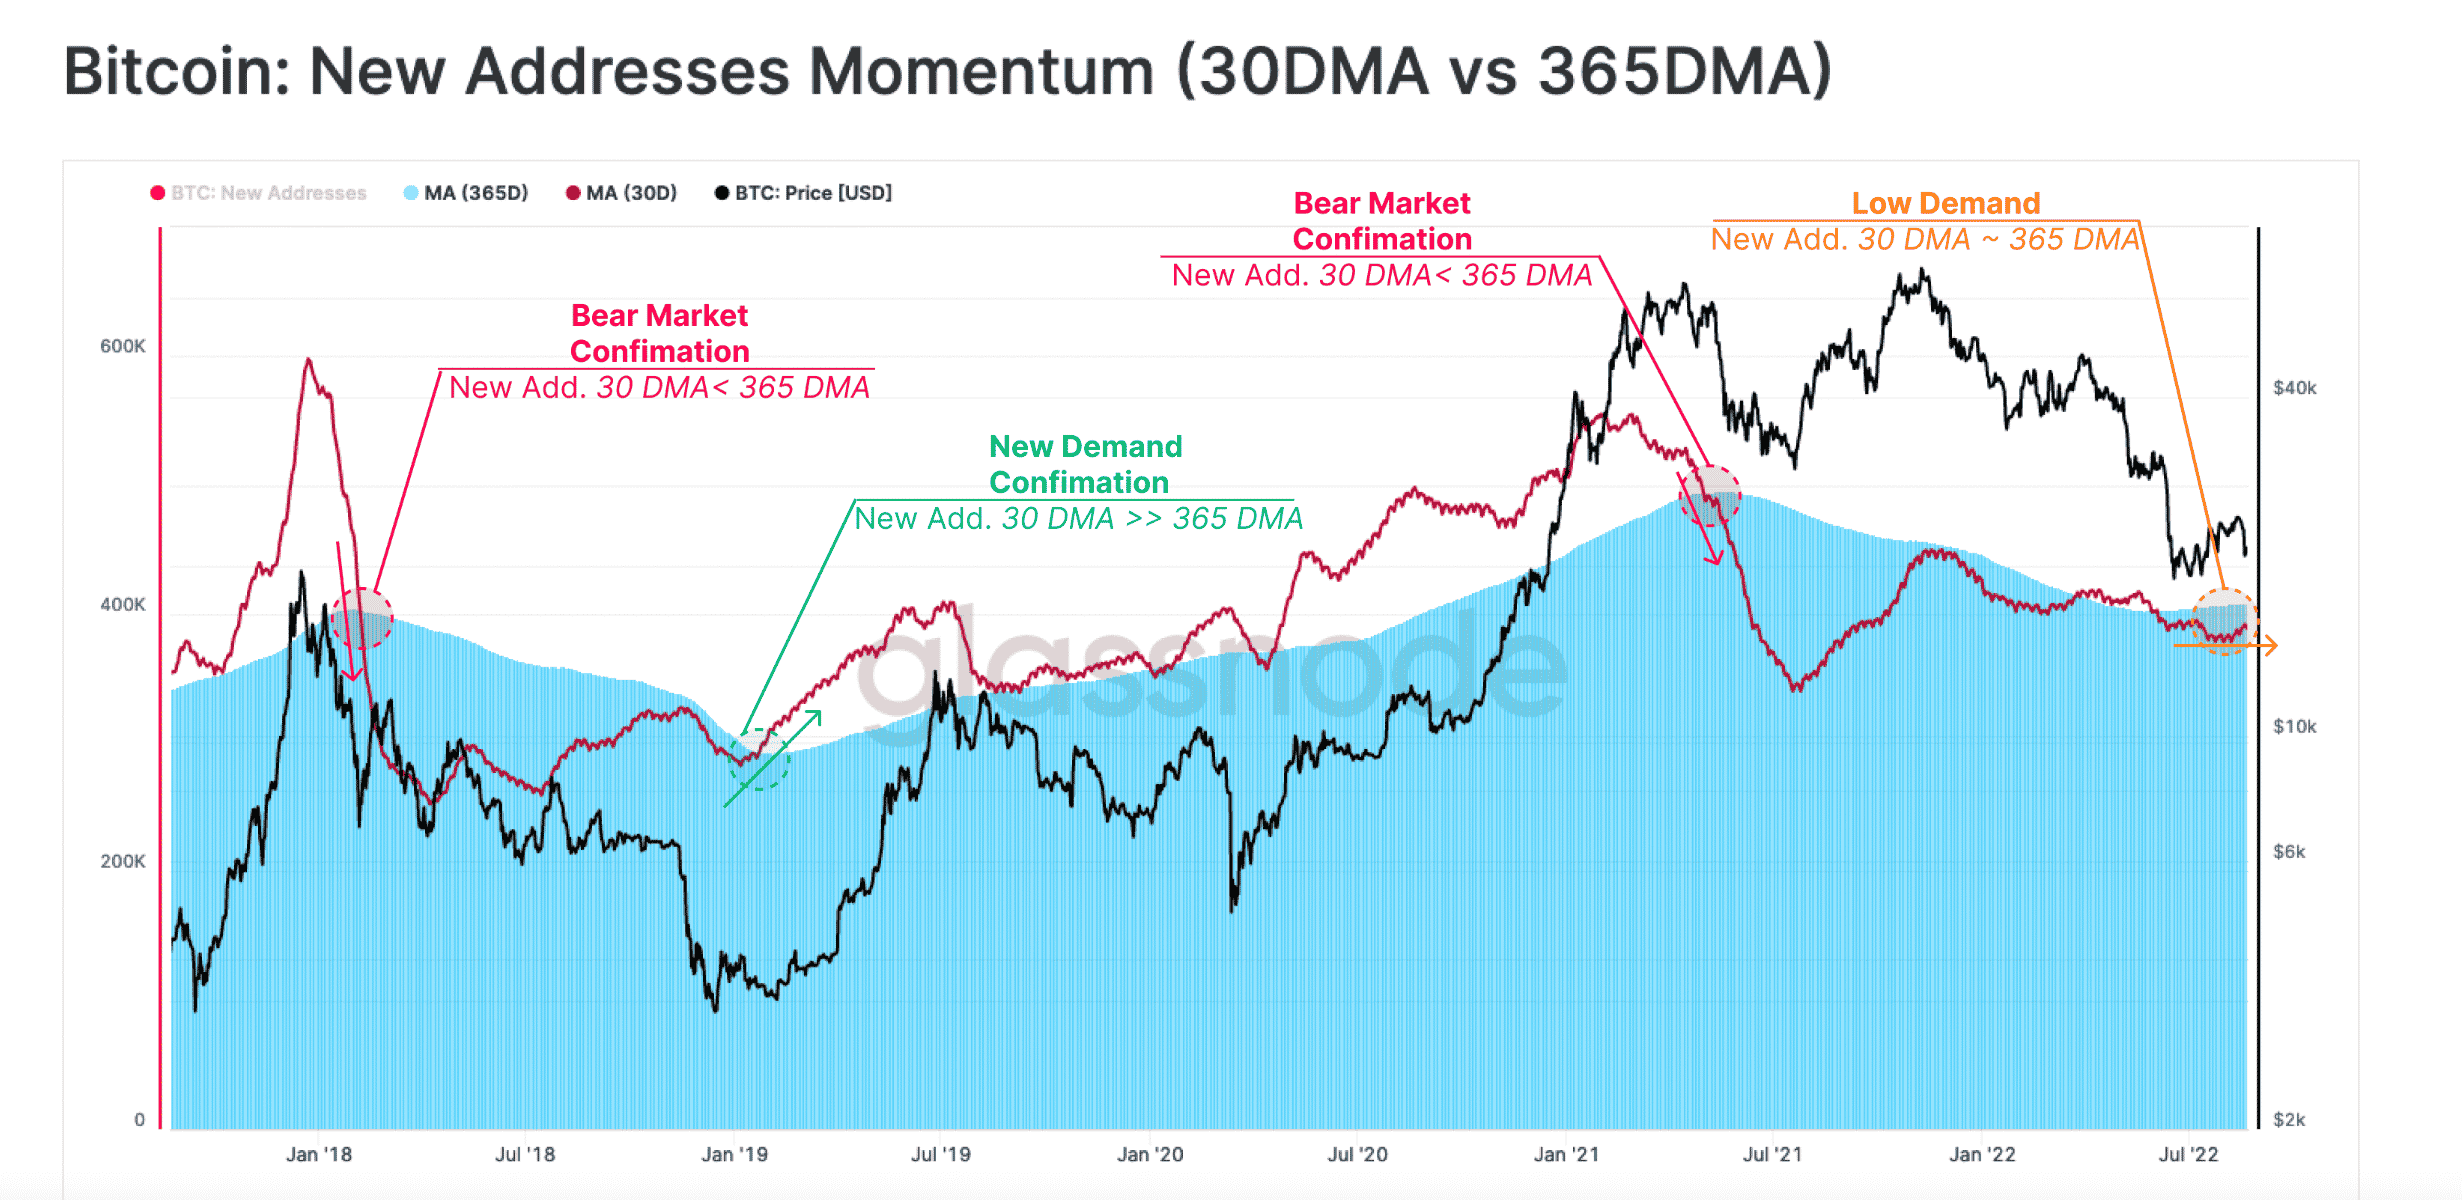
In the report, Glassnode also compared the monthly average of new addresses on the BTC network against the yearly average to understand the shift in sentiment.
It found that when the price of BTC plummeted from the April 2021 all-time high (ATH), the 30d moving average of new address had also fallen sharply below the 365d moving average. Thus, establishing a correlation between a decline in network activity and a bear run.
After a long period of market consolidation, the 30d moving average went above the 365d moving average. It indicated that new buyers had entered the market, forcing the price of BTC to go up.
In the current market, Glassnode concluded that the recent spot price bounce above realized price indicates that the monthly average of new addresses was still lower than the yearly average. Hence, the bears were still in control of the market.
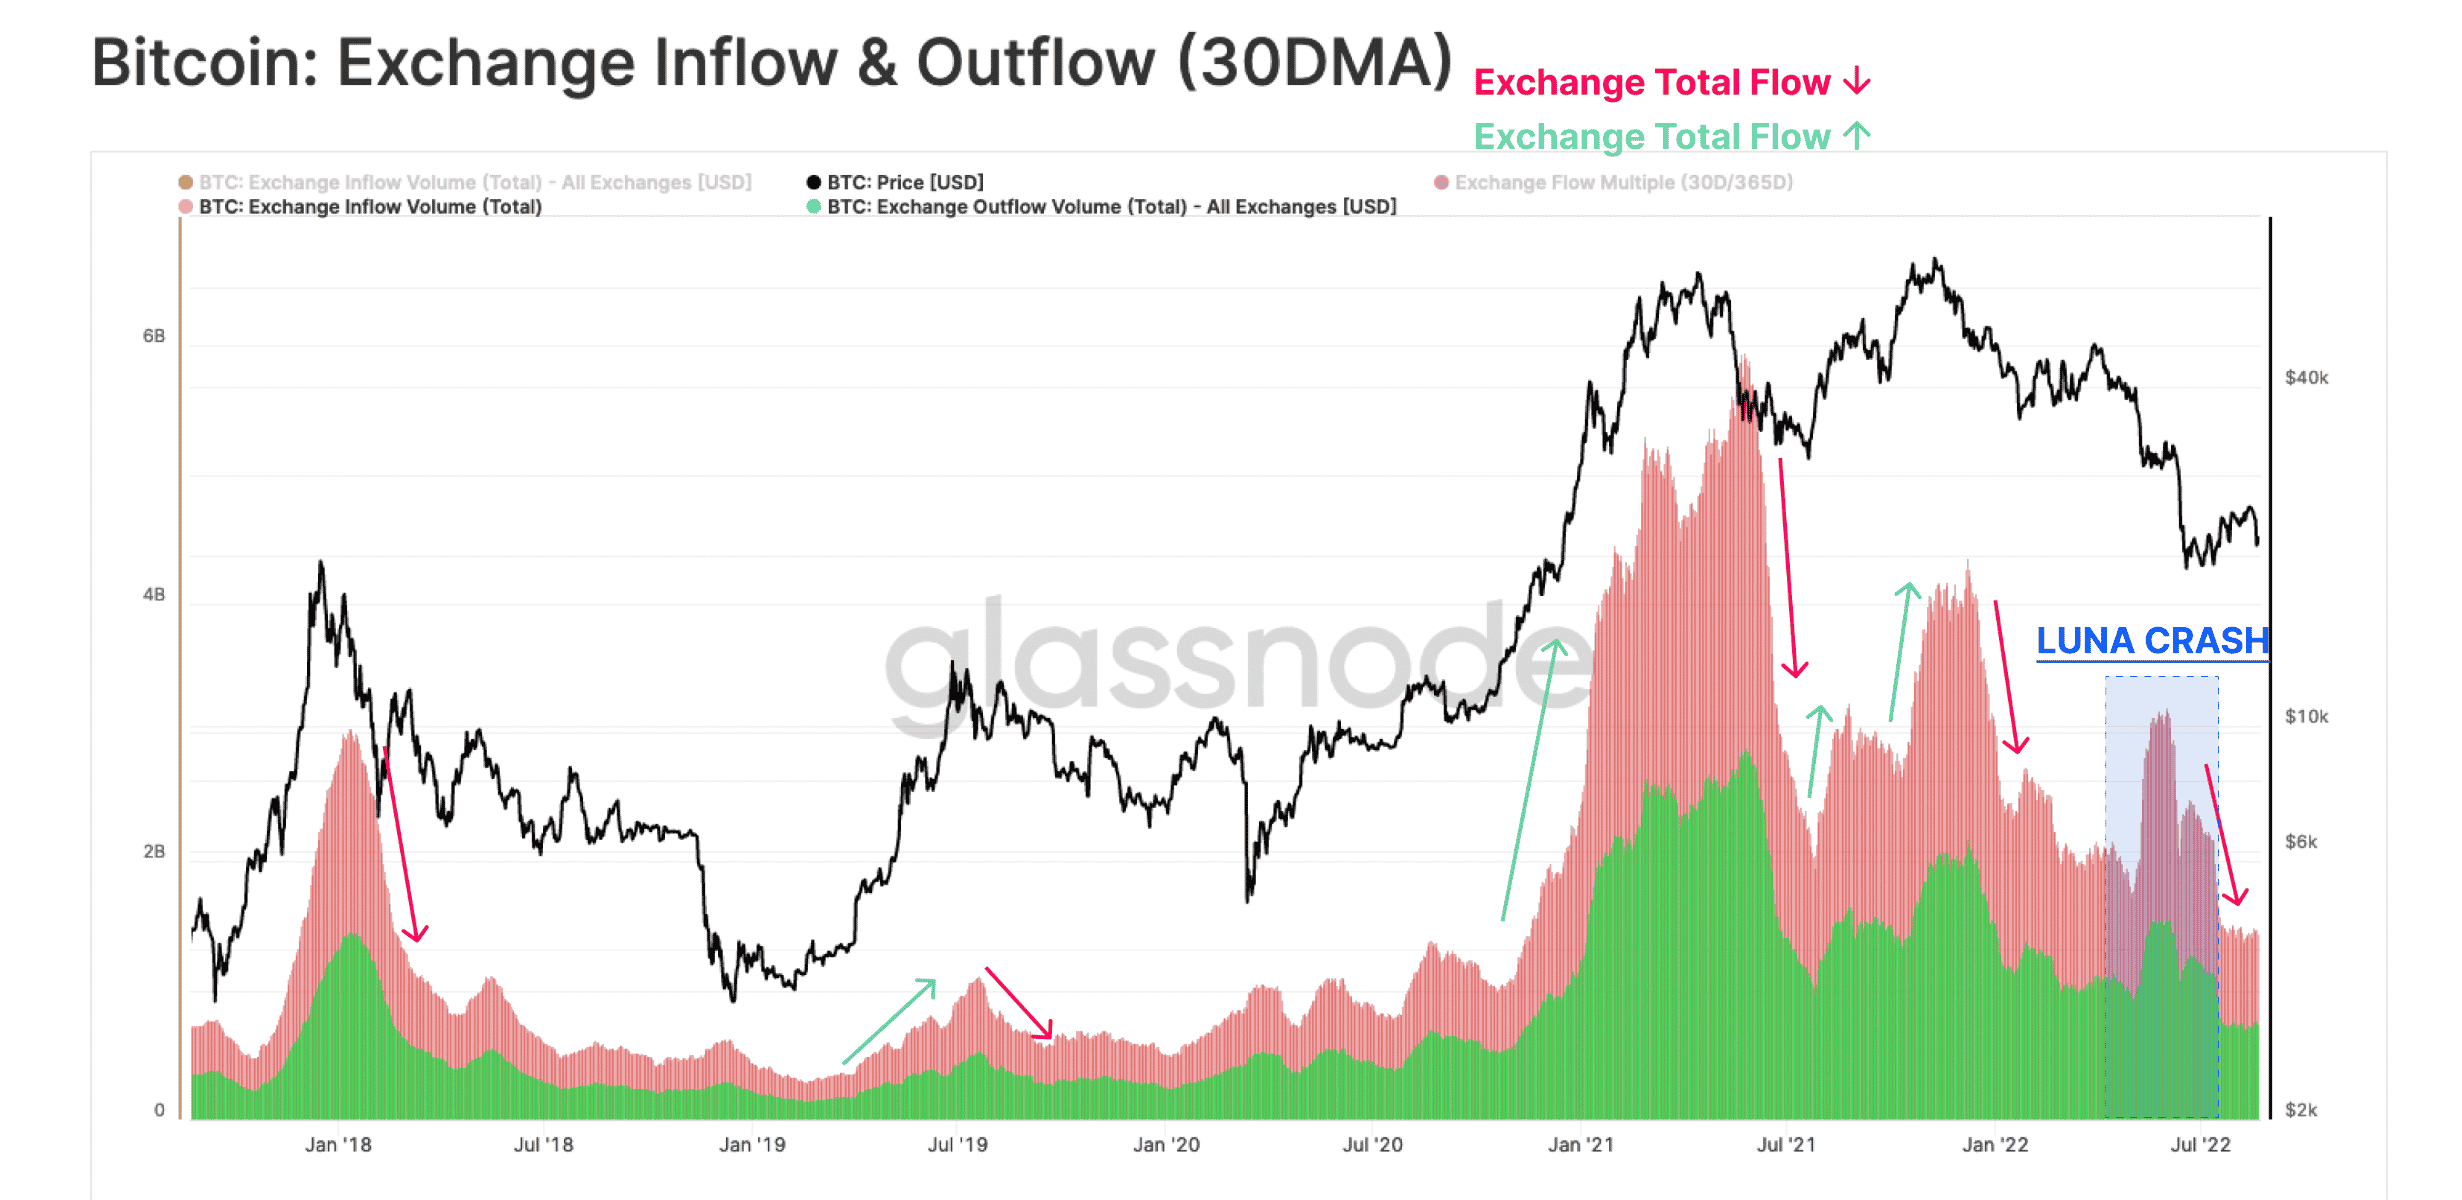
In case you intend to ape in and ‘buy the dip,’ Glassnode, in its report, found that “a general lack of speculative interest in the asset (BTC) persists.” This is a result of the decline in exchange flows to late-2020 levels.


![Rising bond yields put Bitcoin [BTC] at risk — a Fed rate hike could be next](https://ambcrypto.com/wp-content/uploads/2026/08/IMG_4752-e1785656382502.webp)