BNB outperforms ETH in this area, but where is the catch

- Despite beating Ethereum, BNB’s DAU was declining.
- BNB’s RSI and stochastic were overbought, which was bearish.
Binance Coin [BNB] outperformed the king of altcoins, Ethereum [ETH], by a huge margin in terms of daily active addresses. As per CoinMarketCap, BNB’s daily active users exceeded 815,000, while Ethereum and Polygon [MATIC] reached 344,000 and 277,000, respectively.
Focus on users. pic.twitter.com/8FN6OesRg0
— CZ 🔶 BNB (@cz_binance) February 6, 2023
Read Binance Coin’s [BNB] Price Prediction 2023-24
BNB’s huge lead in DAU was good news for the blockchain because it reflected BNB’s increased usage and popularity. However, data from Dune Analytics told a different story, as it revealed that BNB’s DAU has been declining in recent months.
Not only did the DAU decline, but BNB’s NFT space also witnessed a similar trend in terms of monthly NFT volume. Furthermore, despite BNB’s low gas fee, the network’s gas usage declined over the last few weeks.
Was BNB affected?
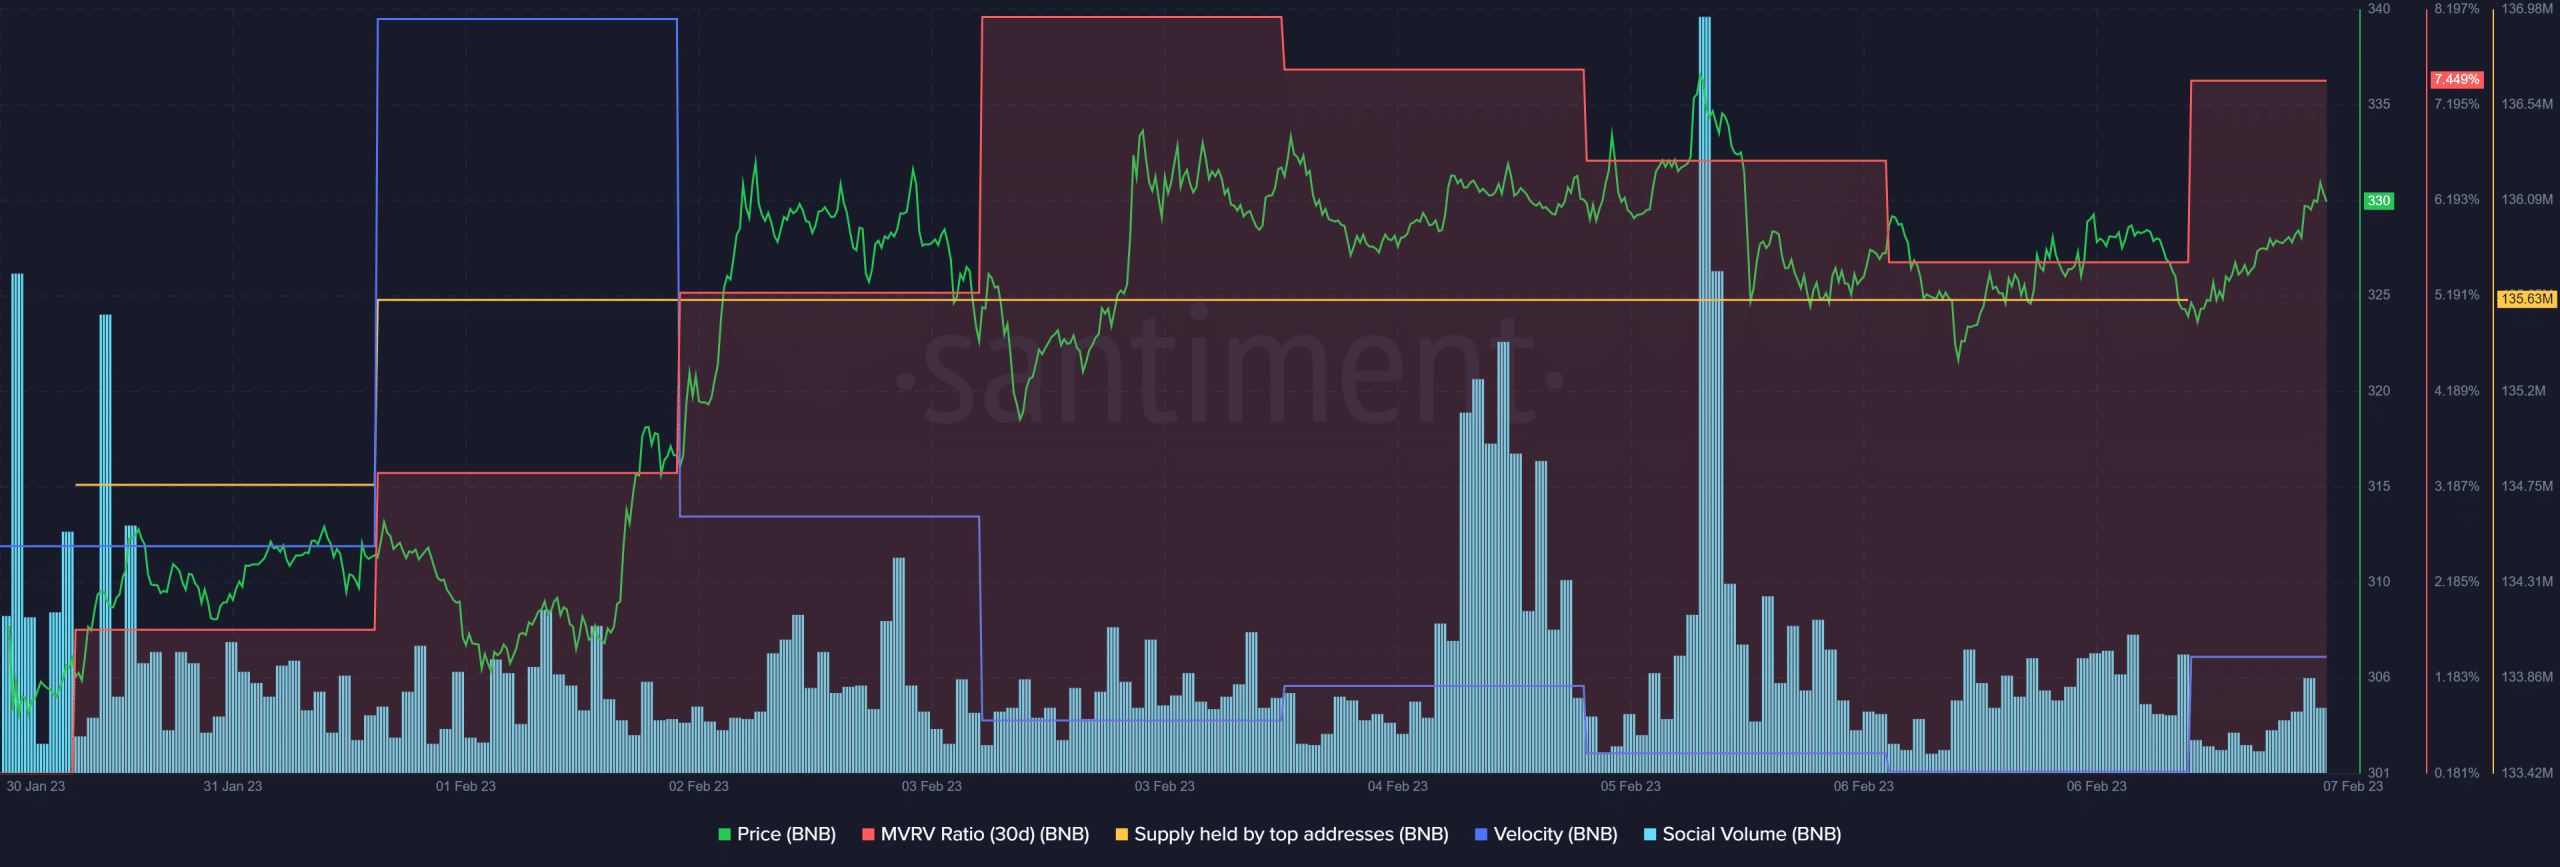
Despite decline in many areas, BNB’s performance on the metrics front did not seem to be affected much. For example, BNB’s MVRV Ratio went up considerably last week, which helped BNB increase its price by 6% in the last seven days.
BNB’s social volume also spiked last week, reflecting its popularity in the crypto space. Furthermore, the supply held by top addresses registered a slight increase, which suggested whales’ trust in BNB. However, BNB’s velocity was concerning as it declined sharply in the last few days.
Investors must be cautious
Though Santiment’s chart revealed quite a few optimistic metrics, CryptoQuant pointed out that BNB’s Relative Strength Index (RSI) and Stochastic were both in overbought positions, which could increase selling pressure in the coming days.
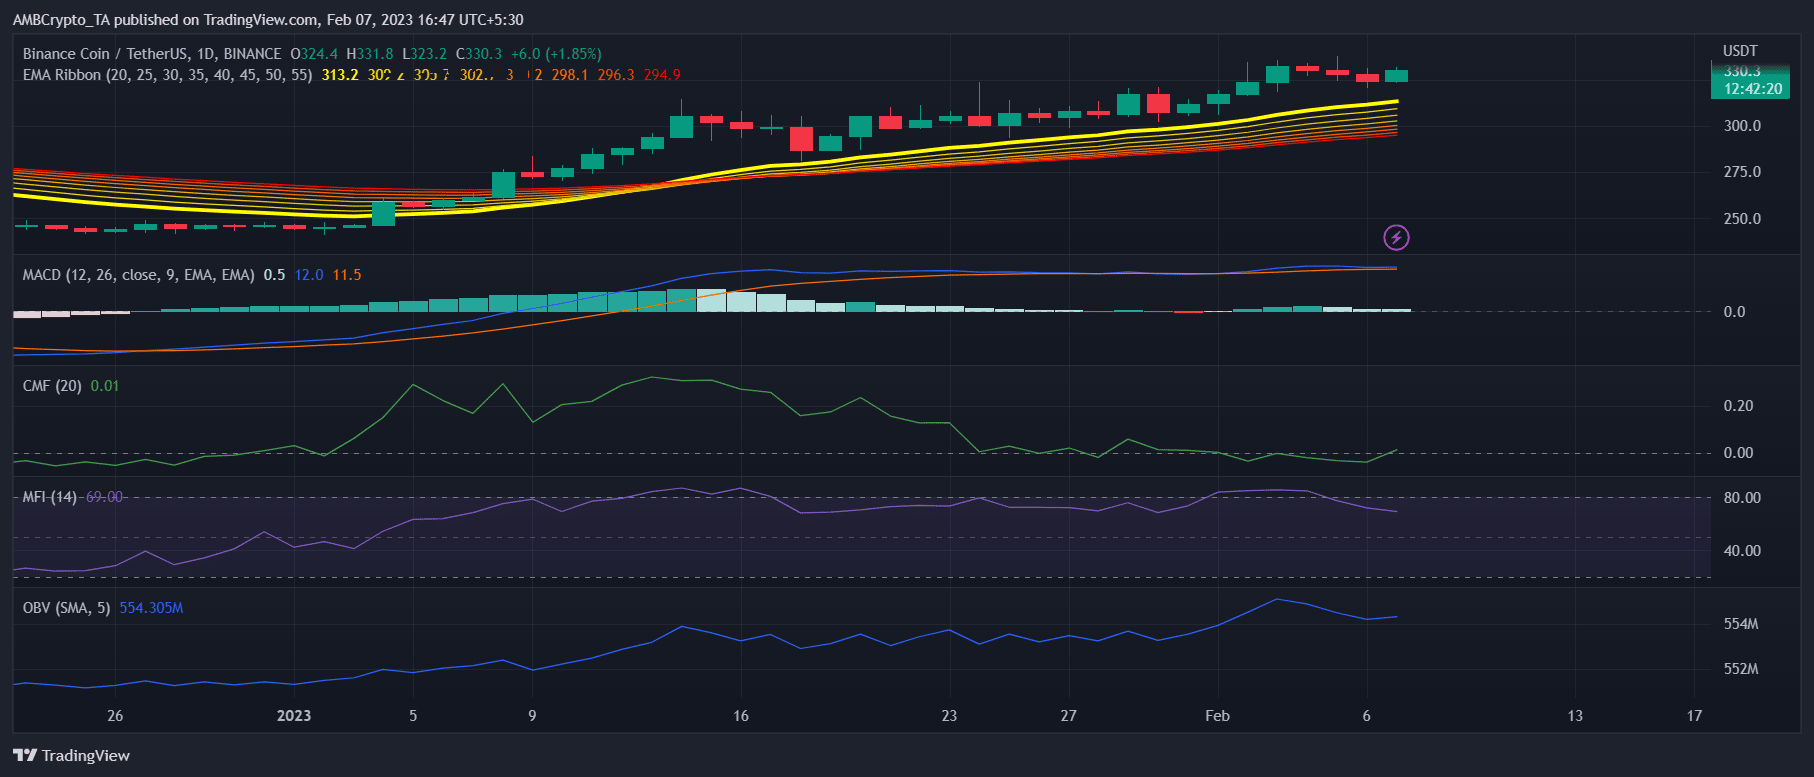
At press time, BNB was trading at $330.52, with a market capitalization of more than $52.1 billion. It also aligned a few of the other market indicators with the bears’ interests.
Realistic or not, here’s BNB market cap in BTC’s terms
The MACD displayed the possibility of a bearish crossover soon. BNB’s Money Flow Index (MFI) was headed downward, further increasing the chances of a price decline in the coming days. However, the rest looked bullish and suggested a further uptrend.
For example, the Chaikin Money Flow (CMF) registered an uptick, which was a development in the buyers’ favor. Another positive indicator was the On Balance Volume (OBV), which was relatively up. Furthermore, the Exponential Moving Average (EMA) Ribbon remained bullish, as the 20-day EMA was above the 55-day EMA.