BNB retests multi-month resistance level of $338: Is a retracement likely
BNB hit a stiff resistance that has always set it in retracement in 2021, 2022 and 2023. If the trend repeats, BNB may witness a pullback before any further rally.

Disclaimer: The information presented does not constitute financial, investment, trading, or other types of advice and is solely the writer’s opinion.
– The stochastic RSI on the daily chart was in the overbought zone at press time.
– Trading volumes declined while the mean coin age rose, pitting sellers against buyers.
Binance Coin [BNB] has hit a crucial multi-month resistance level of $338, which may affect the uptrend. BNB clocked over 7% gains in the past week but has steadied in the past 24 hours, up by only 0.8%, according to Coinmarketcap.
Read Binance Coin’s [BNB] Price Prediction 2023-24
Meanwhile, BTC consolidated near $30k, chalking a sideways structure between $29.6k and $31k. Continued consolidation of the king of crypto could set BNB to a similar structure or a short pullback if overall sentiment remains bullish.
Will the bulls bypass the $338 hurdle?
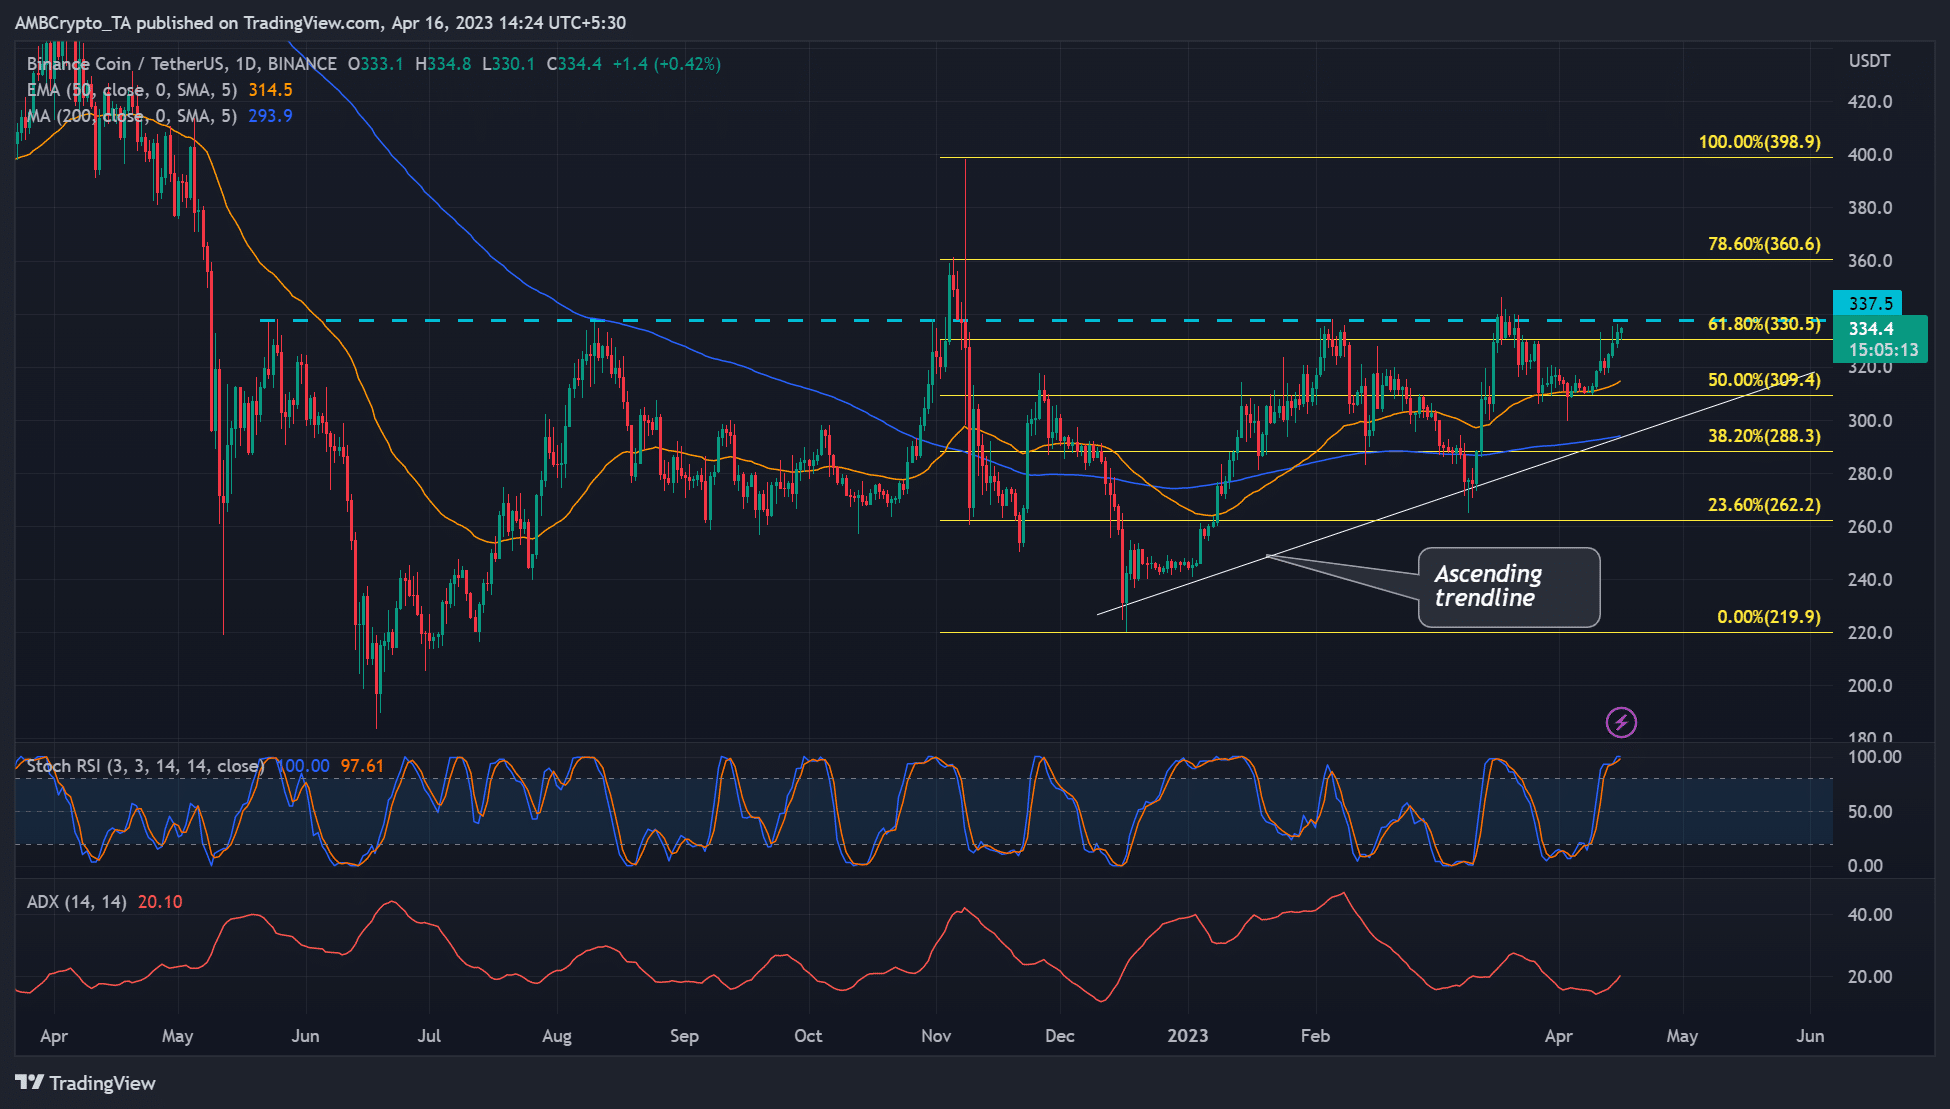
The BNB/USDT pair has surged to the stiff resistance level of $338. This level has been a key price ceiling in 2021 (February), 2022 (May, August, November) and 2023 (February, March, and now April). Throughout these periods, apart from the current April retest, BNB retraced after hitting the resistance level.
Besides, the stochastic RSI strengthened, but the oscillator entered the overbought zone, which means bulls may need a break soon. BNB may be in for a quick pullback if that is the case.
Such a move could offer an excellent shorting opportunity at the current level if the downtrend extends to 50% Fibonacci ($309.4) or the intersection of 200 MA and ascending trendline ($293). A breach below the 38.2% Fib level ($288.3) and ascending trendline could flip the structure to bearish.
Contrary to the above assumption, a daily close above $338 could set BNB to target the 78.6% Fibonacci level ($360.6) or the overhead resistance level of $398.9. Notably, the ADX (Average Directional Index) had an uptick indicating the uptrend was still strong by press time.
The mean coin age rose, but price volatility eased
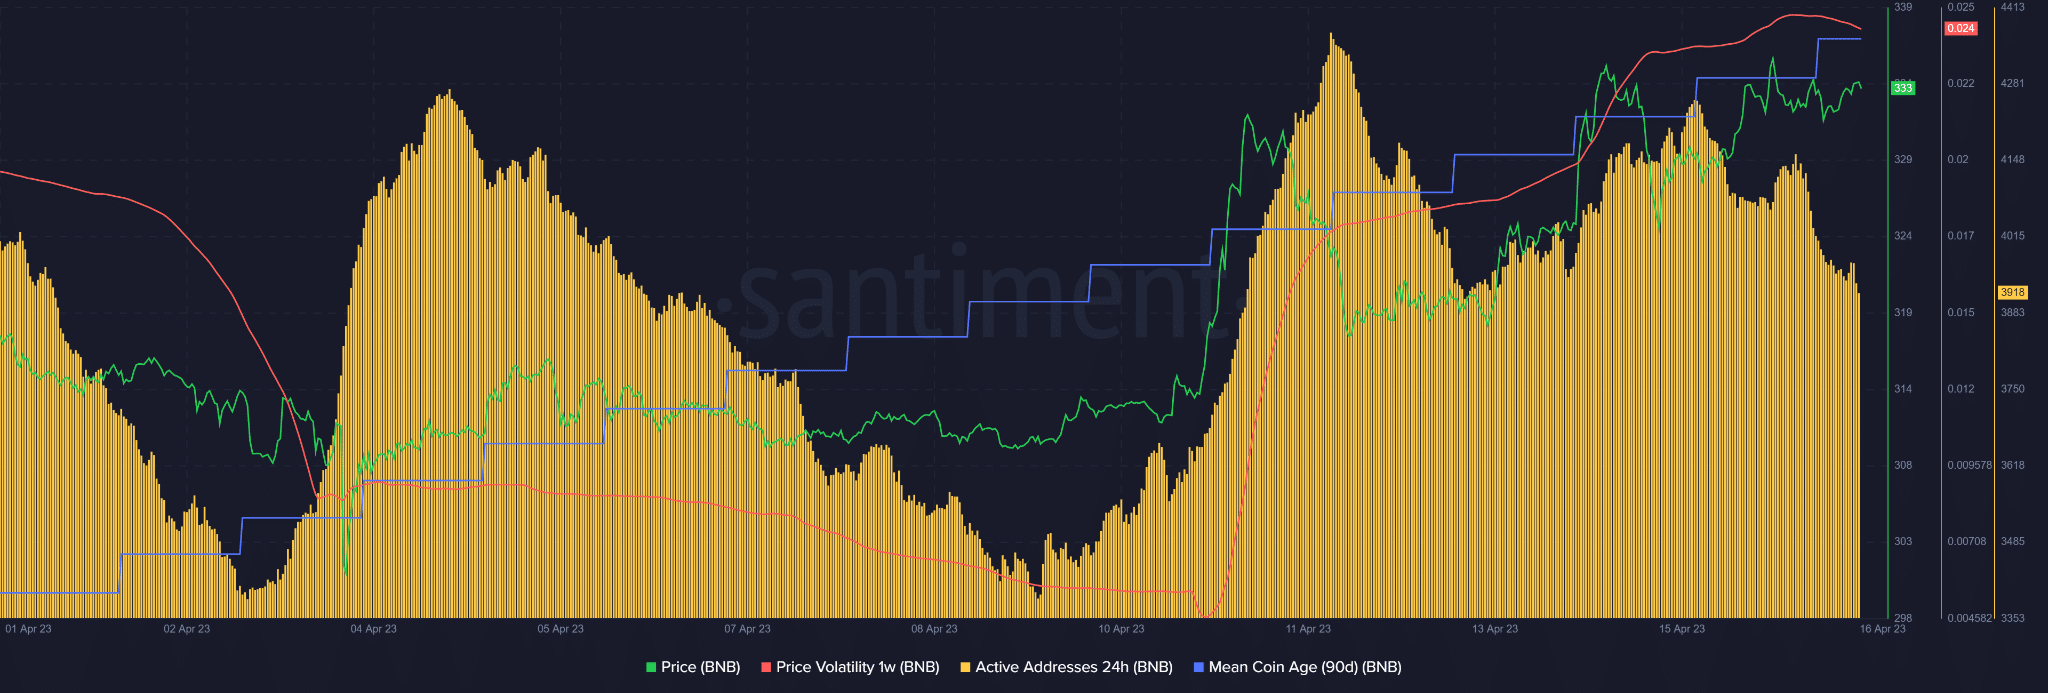
The 90-day mean coin age rose steadily in the past few days – indicating an increased accumulation of BNB tokens and a potential rally. It could give bulls little hope.
Is your portfolio green? Check BNB Profit Calculator
However, trading volume (yellow bars) has been declining since 12 April, which could tap sellers to gain market entry. In addition, the weekly price volatility tapered off, pointing to reduced accumulation seen in the past few days.
But BTC’s price action could set BNB’s price direction. A break above $31k could set BNB to overcome the $338 hurdle, while a slide below $29k may push it into retracement.