BNB is ‘red,’ but where do traders like you really stand?
BNB’s Futures market participants are opening trade positions to bet against the asset's price.

- BNB’s Funding Rate turned negative.
- Key indicators on the price chart also hinted at a continued decline.
Bearish sentiments have overridden Binance Coin’s [BNB] Futures market as the coin’s Funding Rates across cryptocurrency exchanges turned negative, according to AMBCrypto’s analysis of Coinglass data.
Funding Rates are a mechanism used in perpetual Futures contracts to ensure that the contract price stays close to the spot price.
If an asset’s contract price is higher than its spot price, traders who hold long positions pay a fee to traders shorting the asset. Funding Rates return positive values when this happens.
Conversely, if the contract price is lower than the spot price, short traders pay a fee to traders holding long positions, resulting in negative Funding Rates.
When an asset’s Funding Rate is negative, it indicates that more traders are holding short positions.
So, more traders are likely expecting the asset’s price to fall than there are traders buying the asset with the expectation of selling at a higher price.
On the 1st of April, BNB’s Funding Rates returned a negative value of -0.013%. Confirming the bearish trend, the month so far has also witnessed a minor decline in the coin’s Futures Open Interest.
According to Coinglass data, BNB’s Futures Open Interest has decreased by 0.16%. As negative sentiments mount, this is expected to plummet further.
It would thus signal that more traders have begun to close their positions without opening new ones.
BNB’s negative Funding Rate and decline in Open Interest signal a hike in short-term bearish sentiment as well, as market participants expect a drawdown in the coin’s value.
Things look just as bad on the spot market
An assessment of BNB’s key indicators on a 1-day chart also showed a bearish trend.
For example, readings from its Directional Movement Index (DMI) showed the positive directional index (green) resting below the negative index (red) at press time.
When these trend lines are positioned this way, it means that bearish momentum in the market is stronger than bullish momentum. Traders often view it as a signal to exit long and open short positions.
Is your portfolio green? Check out the BNB Profit Calculator
Further, the coin’s MACD line, resting under its signal line, appeared poised to breach the zero line in a downtrend as of this writing.
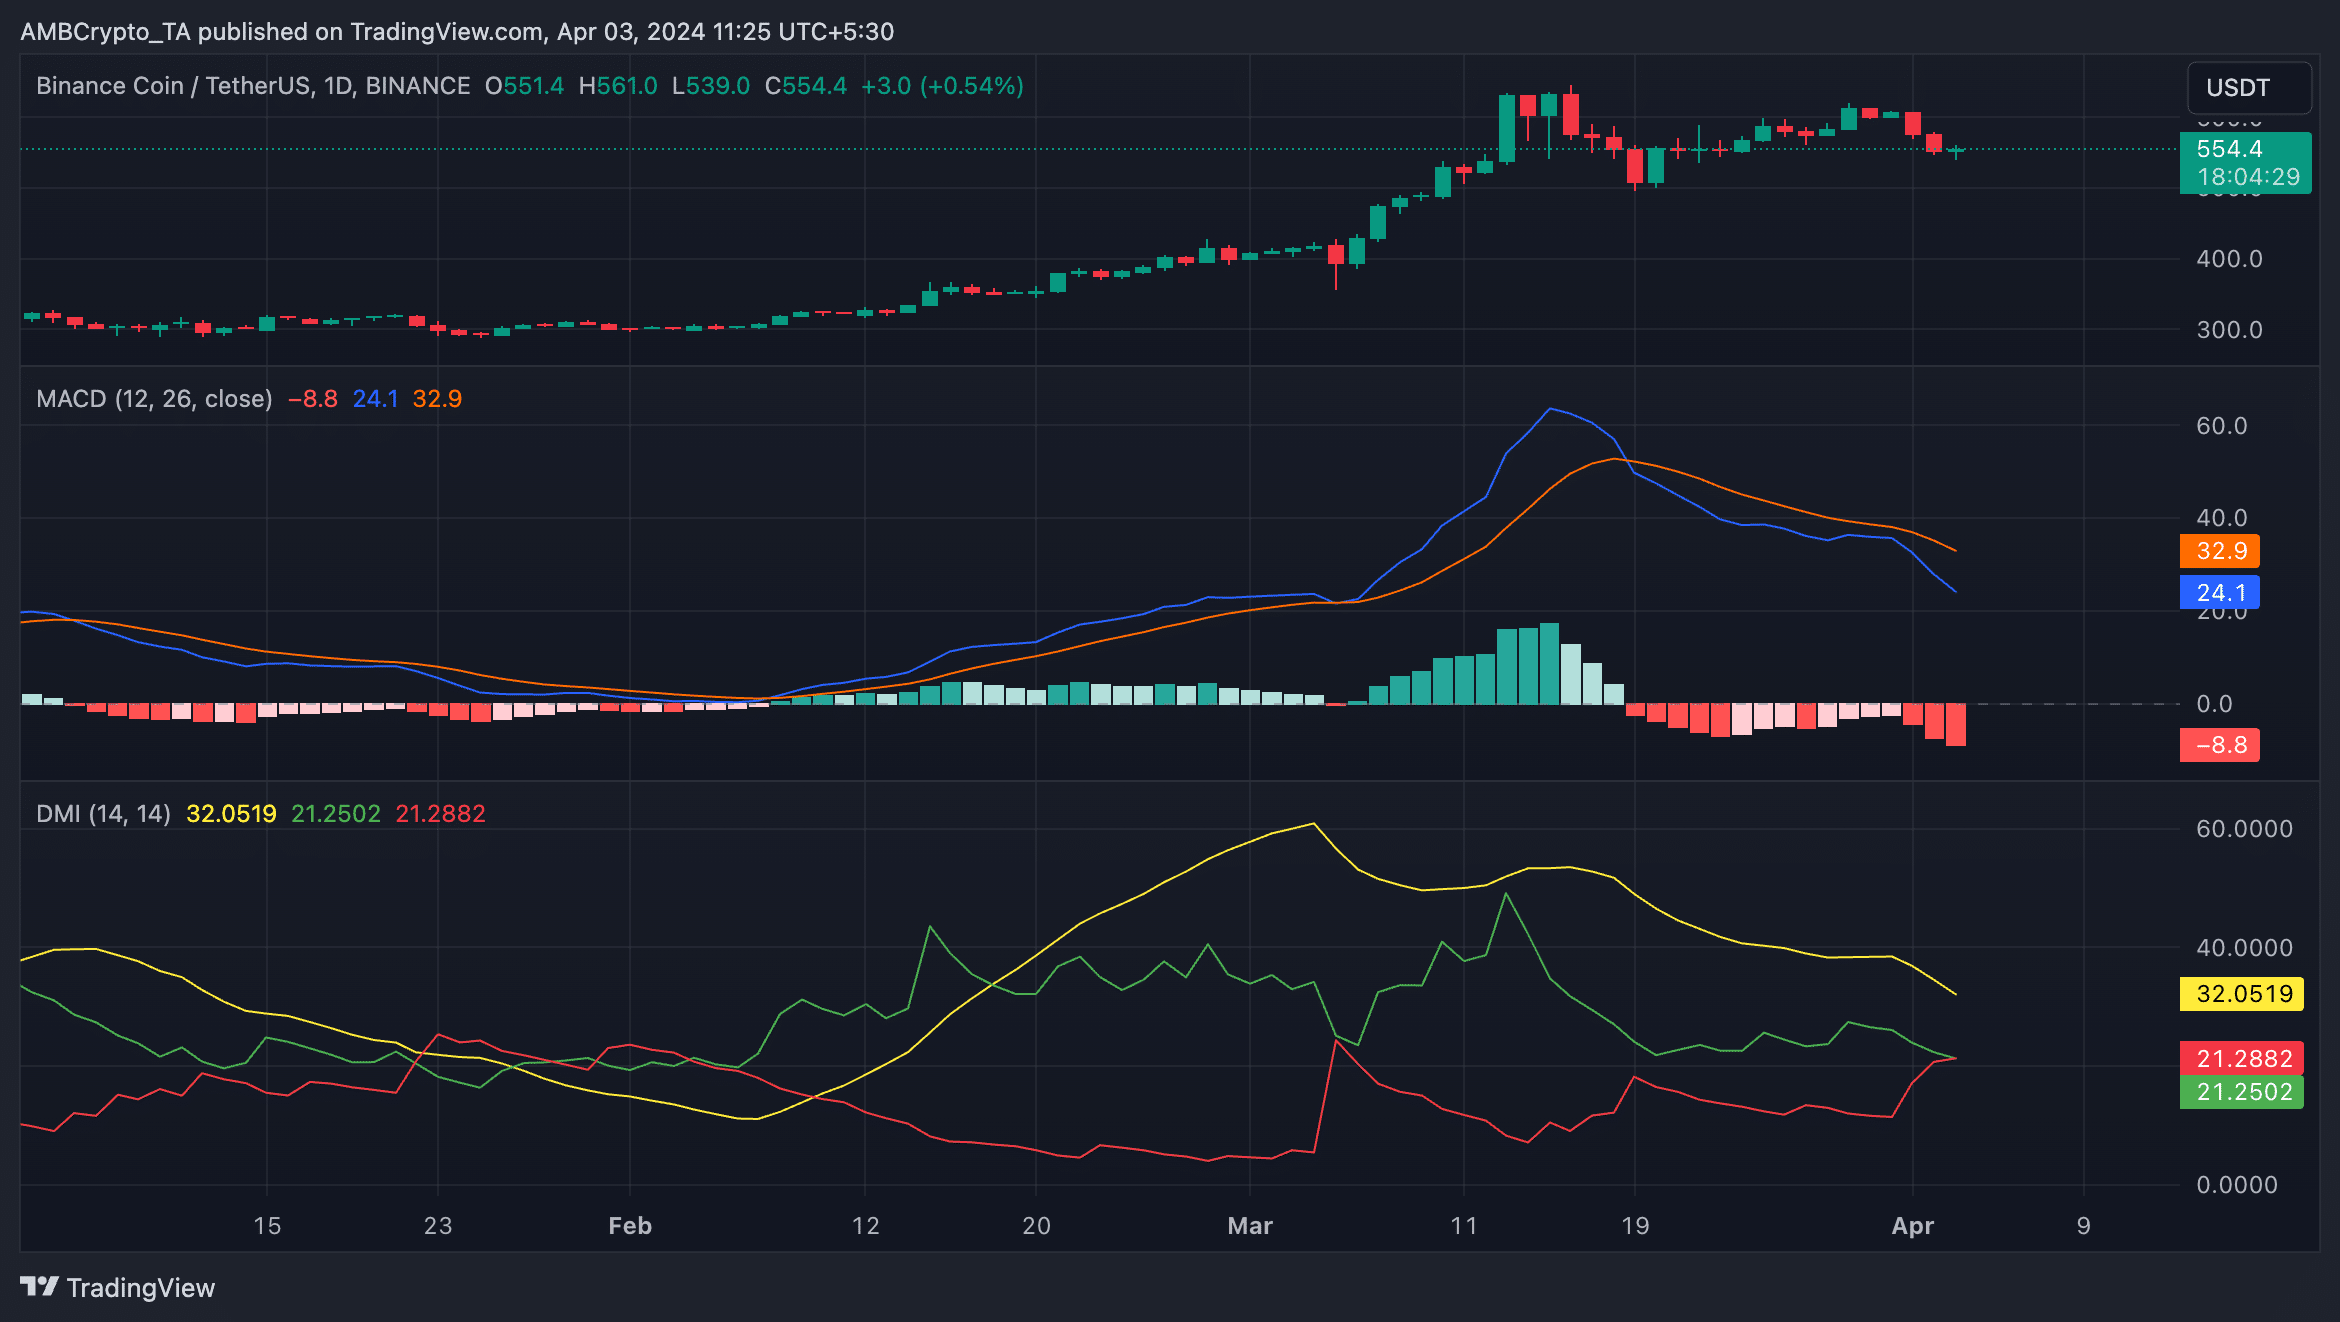
A downward intersection of an asset’s MACD line with its signal line hints at the re-emergence of sellers in the market. For BNB, these lines have been positioned so since the 19th of March.


