Bitcoin: Holders, every time BTC hits $13 billion on this front, the market…
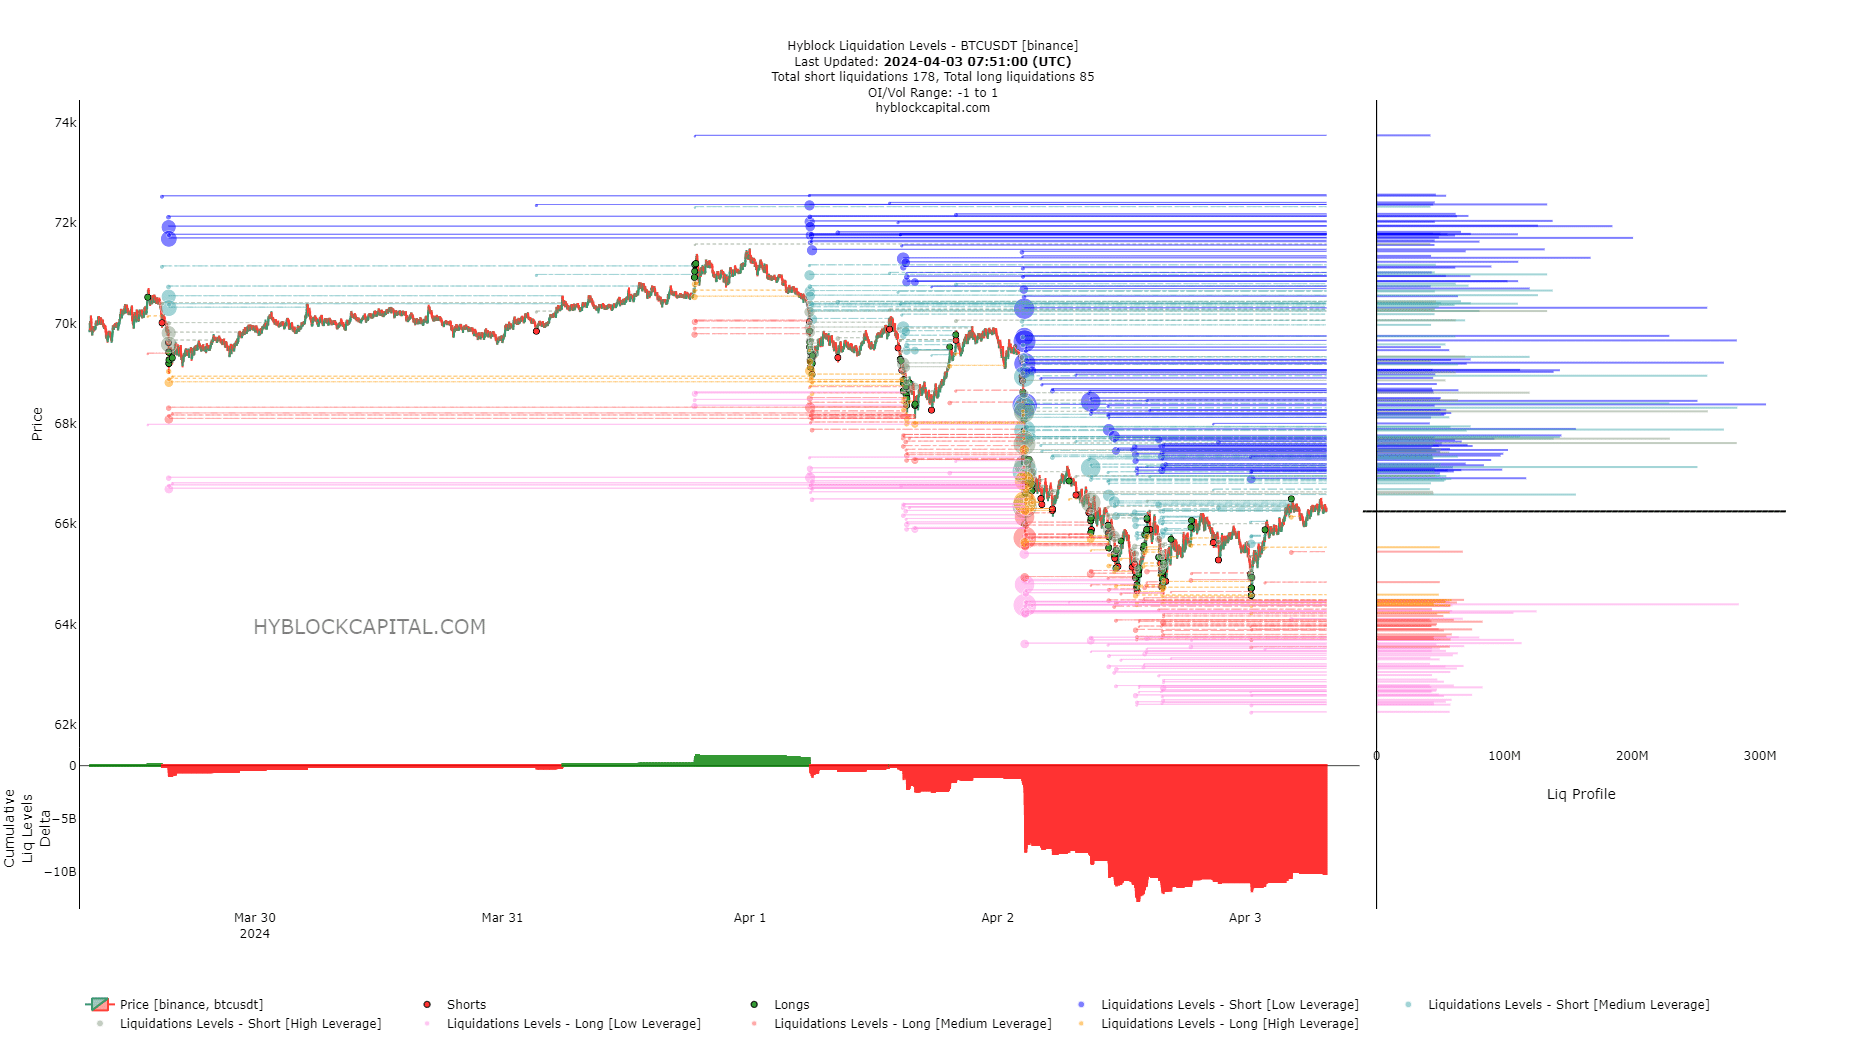
The liquidation levels map from Hyblock signaled that we could see a short squeeze soon.

- Historically, Bitcoin has noted a 50% correction after reaching a new high in Open Interest.
- It is the beginning of a new cycle- is this reason enough for Bitcoin to not repeat history?.
Bitcoin [BTC] noted a 6.8% drop in the past two days even after accounting for the bounce from $64.5k to $66.5k. An Insights post on CryptoQuant drew attention to the fact that each time the Open Interest (OI) pushed above the $13 billion mark, the Bitcoin market witnessed significant corrections.
The OI reached $17.7 billion on the 28th of March. This was followed by the losses we saw in the past few days. With a good chunk of retail participants purged from the futures markets, will BTC see a recovery, or trend downward for the next two months?
Bitcoin Open Interest past the $13 billion mark once more
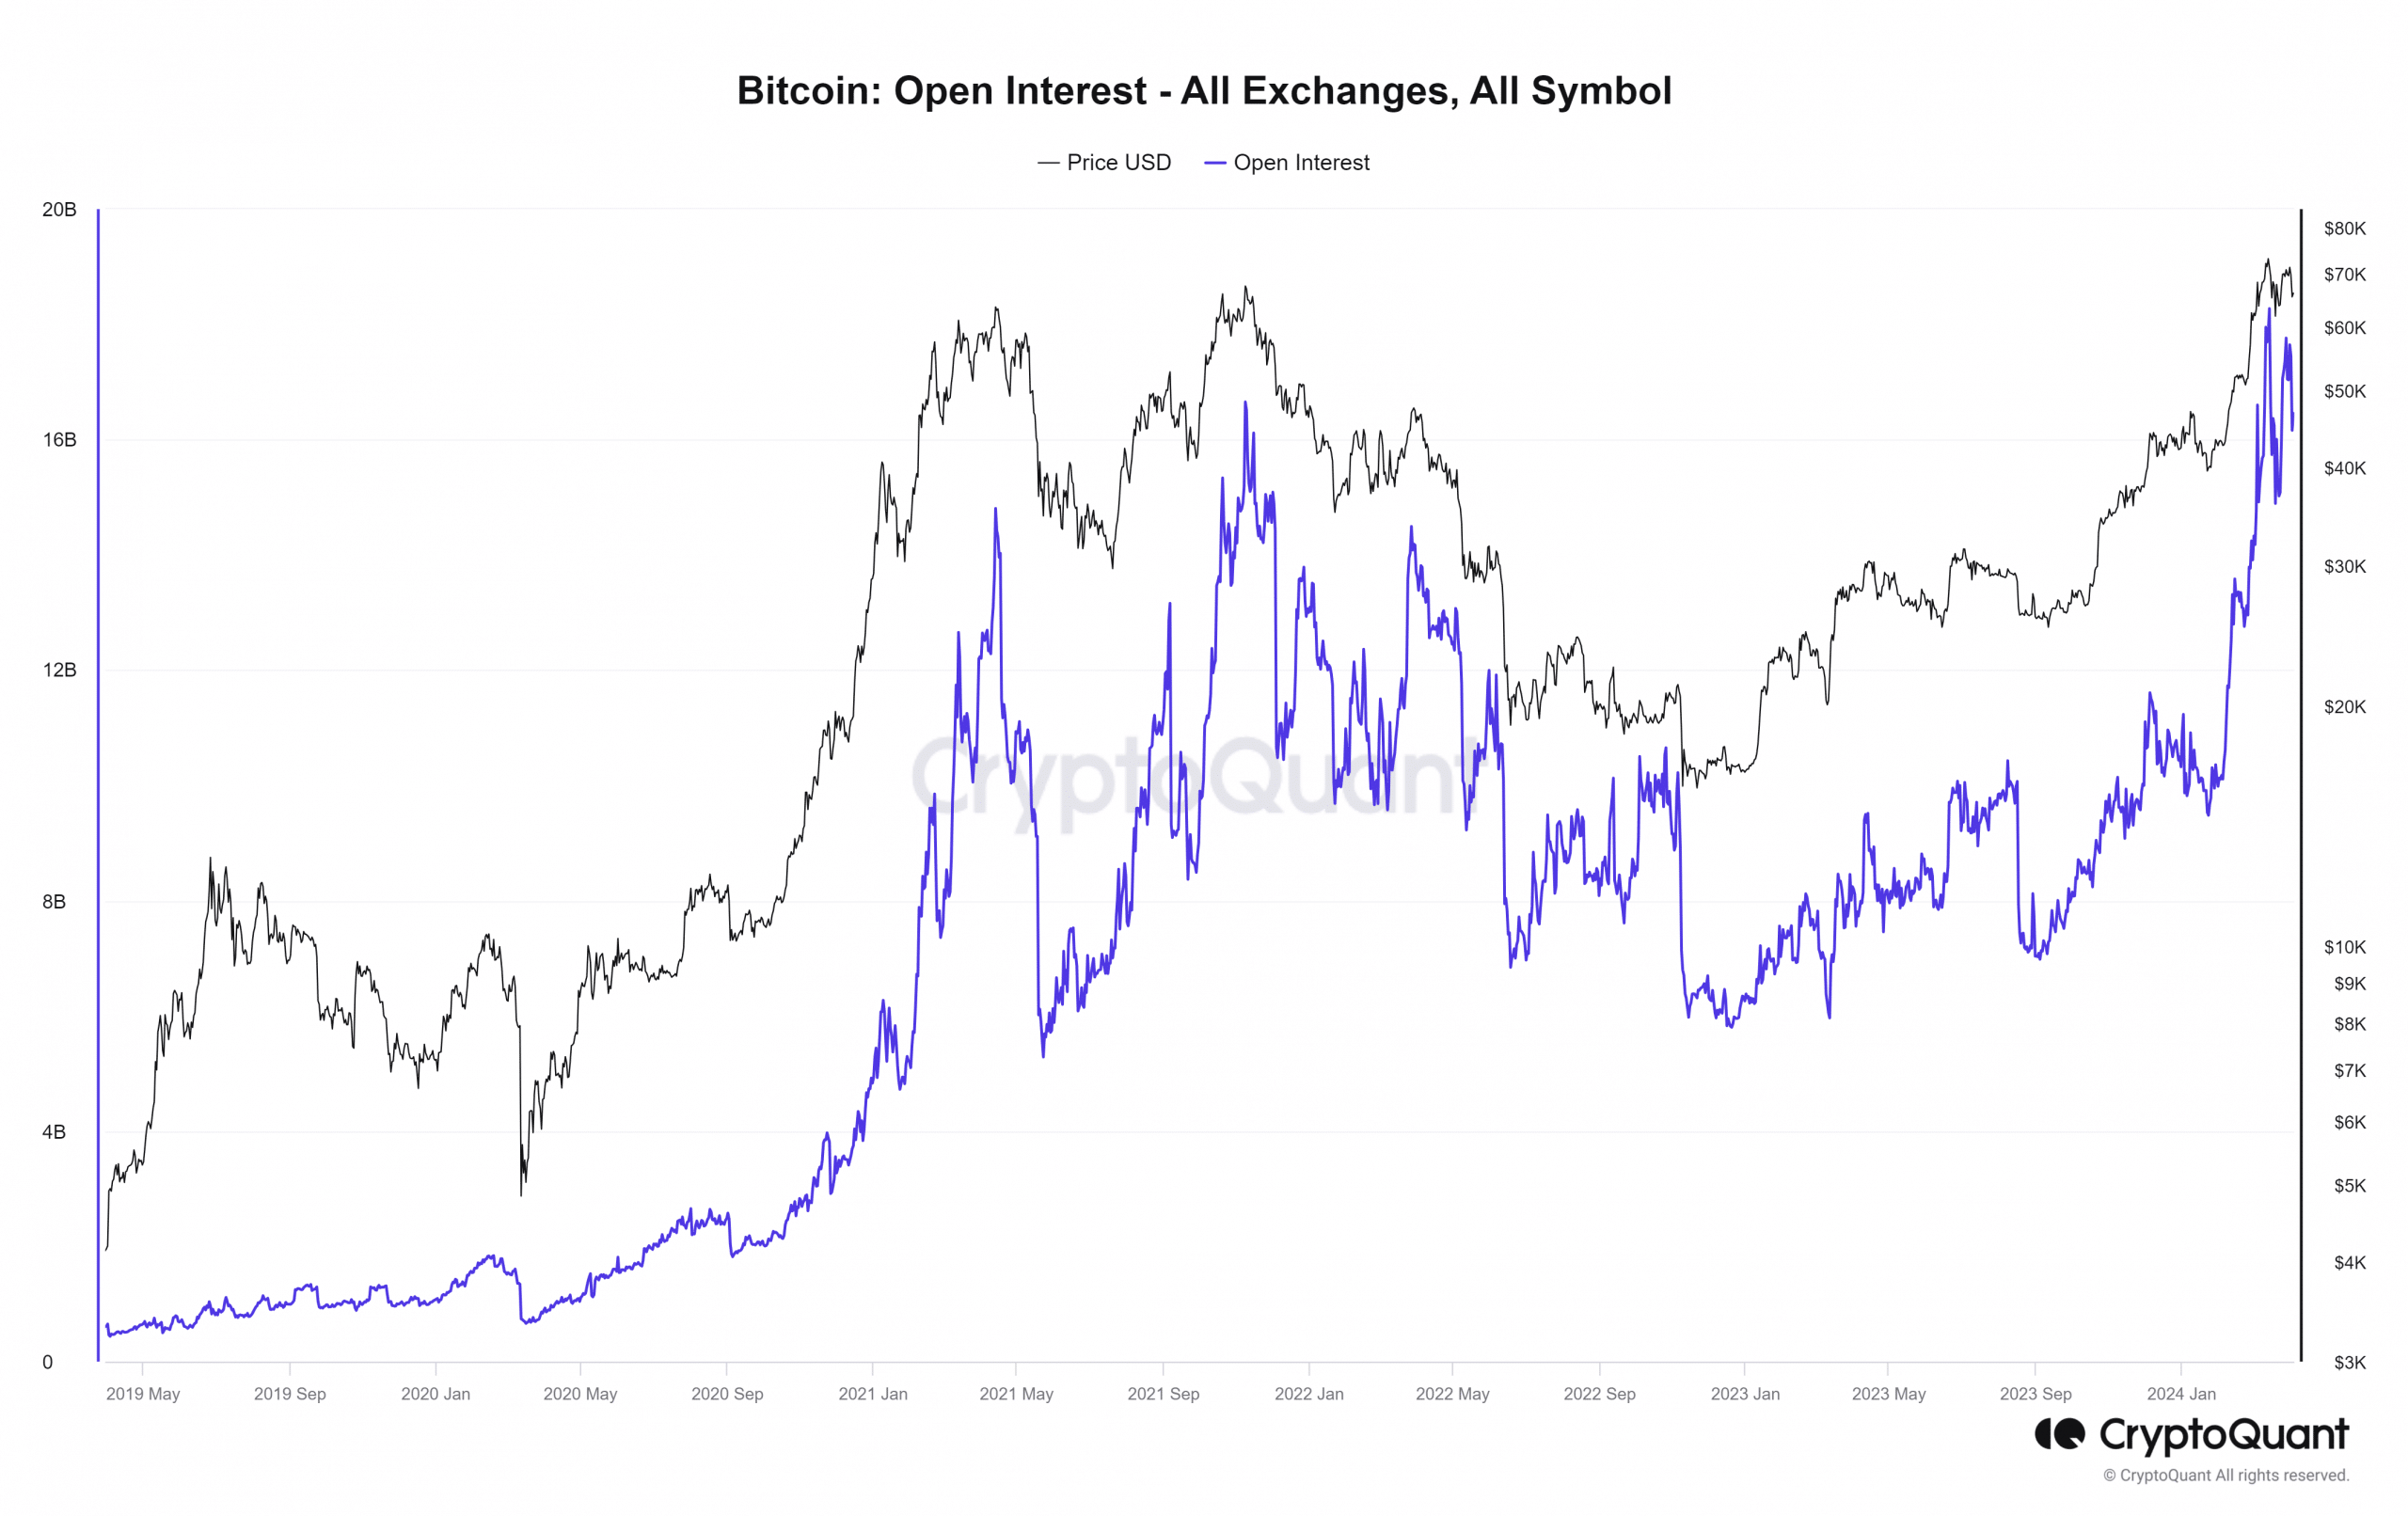
As the Insights post points out, whenever BTC OI climbs past $13 billion, we see a major correction. This was because the extreme highs in OI are achieved when the market is in a state of euphoria or has grown considerably larger.
The 2021 Open Interest peaks reached $14.8 billion in April 2023 and $16.6 billion in November 2021. Both times, BTC witnessed a 50% retracement in the next 70 days.
The recent OI surge measured $18.2 billion, but that does not automatically mean we would see a 50% drop in the next two months. During the 2020 rally, the OI breached previous highs convincingly. This implied the capital inflow was multiple times greater than it was before.
The liquidation charts argue for a bullish short-term reversal
The reason high OI sees large volatility is because price is attracted to liquidity. When a market is propped up by demand from the spot market, significant volatility in a short amount of time is hard due to the spot market orders.
When the market is near a local top, and prices are pushed higher by interest in the futures market but much less spot demand, the possibility of liquidation cascades vastly increases. This is something participants should be aware of.
At press time, the cumulative liq levels delta was highly negative. Short liquidations outnumber long liquidations by a good margin. Therefore, prices could be attracted higher to wipe out the bears.
The $68.2k, $69.6k, and $70.3k are levels that BTC could rally to in the coming days. There was a huge concentration of short liquidations at these levels that could be swept.
Is your portfolio green? Check the Bitcoin Profit Calculator
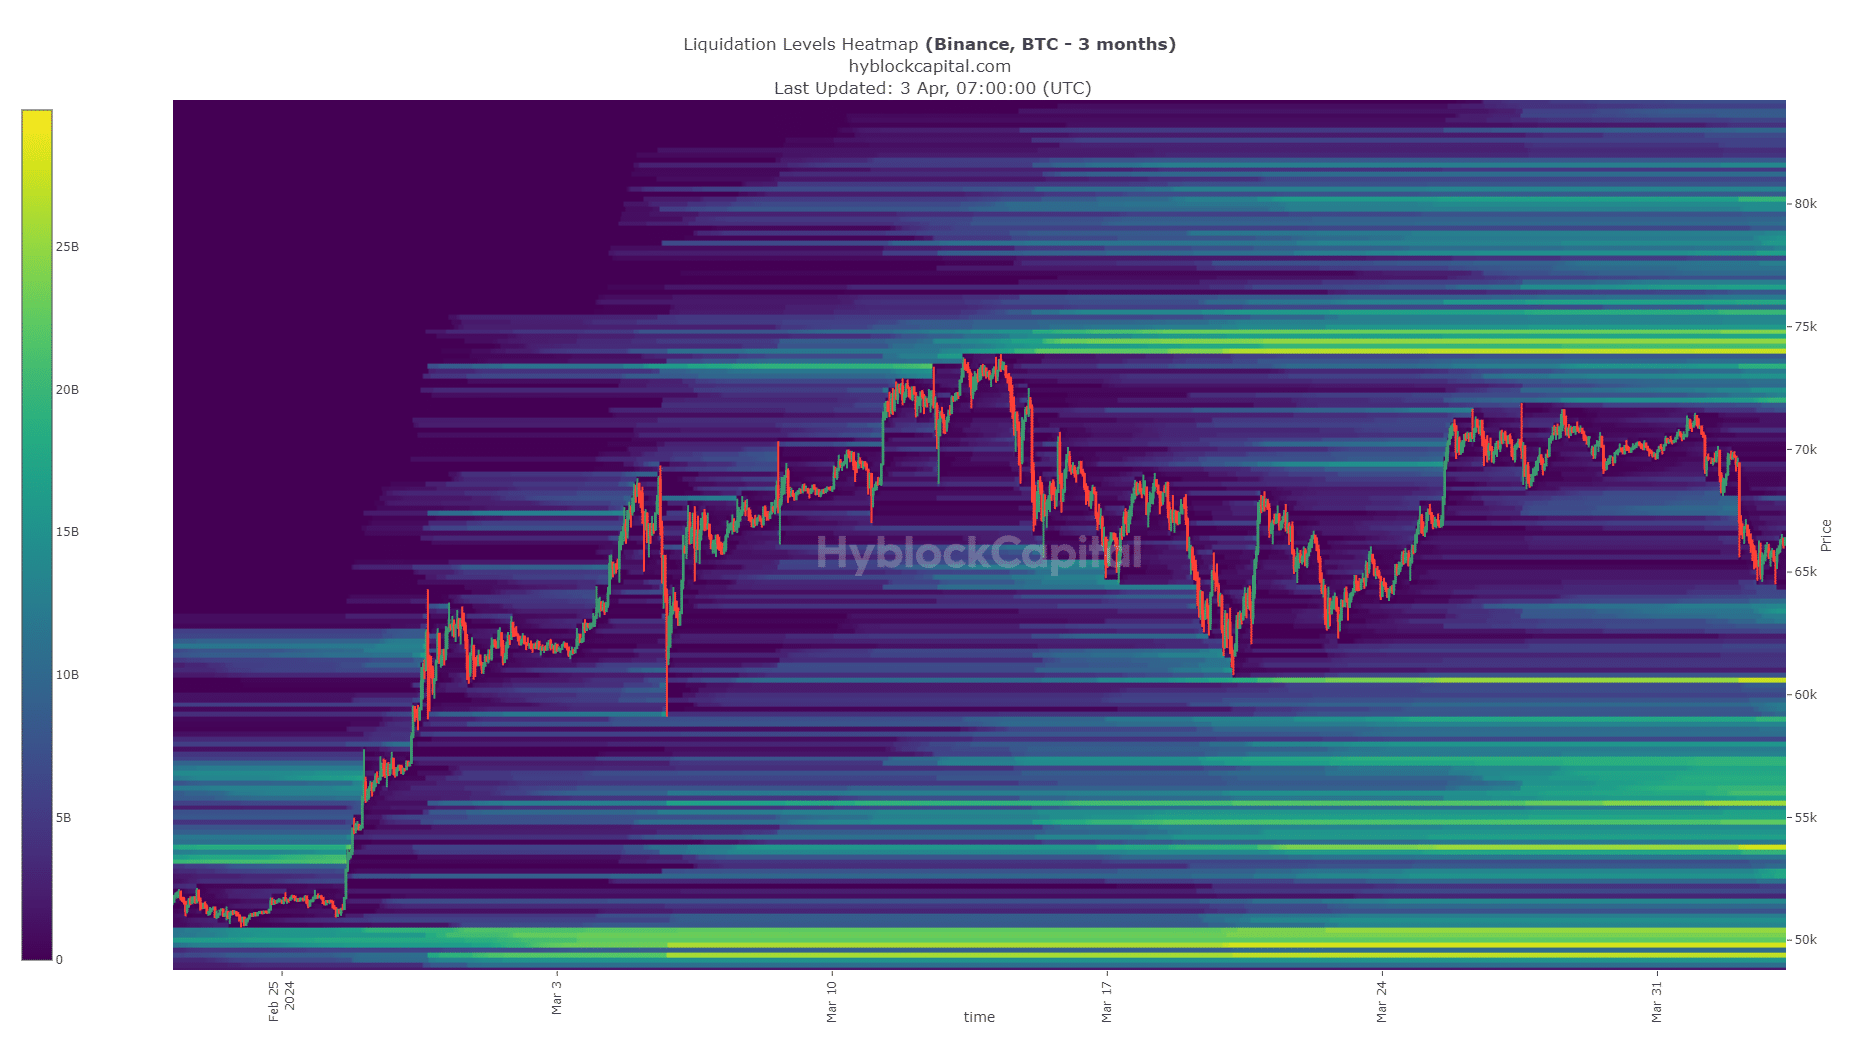
The longer-term outlook for Bitcoin highlighted two areas of interest. To the south, it was the $60.6k region while the $74k-$74.6k zone to the north would prove key.
With the Bitcoin halving event just under three weeks away, we could be in for more volatility before the true bull run begins.


