
- BNB faces key resistance at $560, with a potential breakout targeting $725 for a 19% price increase.
- RSI suggests neutral momentum, while a break above $545 could trigger a bullish rally toward $600.
Binance Coin [BNB] was showing signs of a potential bullish breakout, with a clear inverse head and shoulders pattern forming on its chart. This classic bullish reversal signal suggests that BNB could see a strong upward move. But only if it successfully breaks through key resistance levels.
The left shoulder, head, and right shoulder are marked by rounded bottoms, with the neckline positioned around $560. Traders are closely watching this level, as a break above it would confirm the bullish scenario.
If BNB manages to break the neckline, this pattern points to a target near $725, representing a 19.45% increase from the current price around $545. This level is based on the distance from the head to the neckline, which has been calculated as the potential breakout range.
Key support and resistance levels
BNB currently sits near $545, facing resistance at the $560 neckline. This level will be crucial for determining whether the inverse head and shoulders breakout is confirmed.
If the price closes above $560, a sustained bullish rally could be triggered, with $725 acting as the next major resistance level.
On the downside, the immediate support lies around $530, a level that has previously held during recent price actions. Should BNB break below $530, the next significant support zone is around $383, which could lead to a weakening of the bullish case.
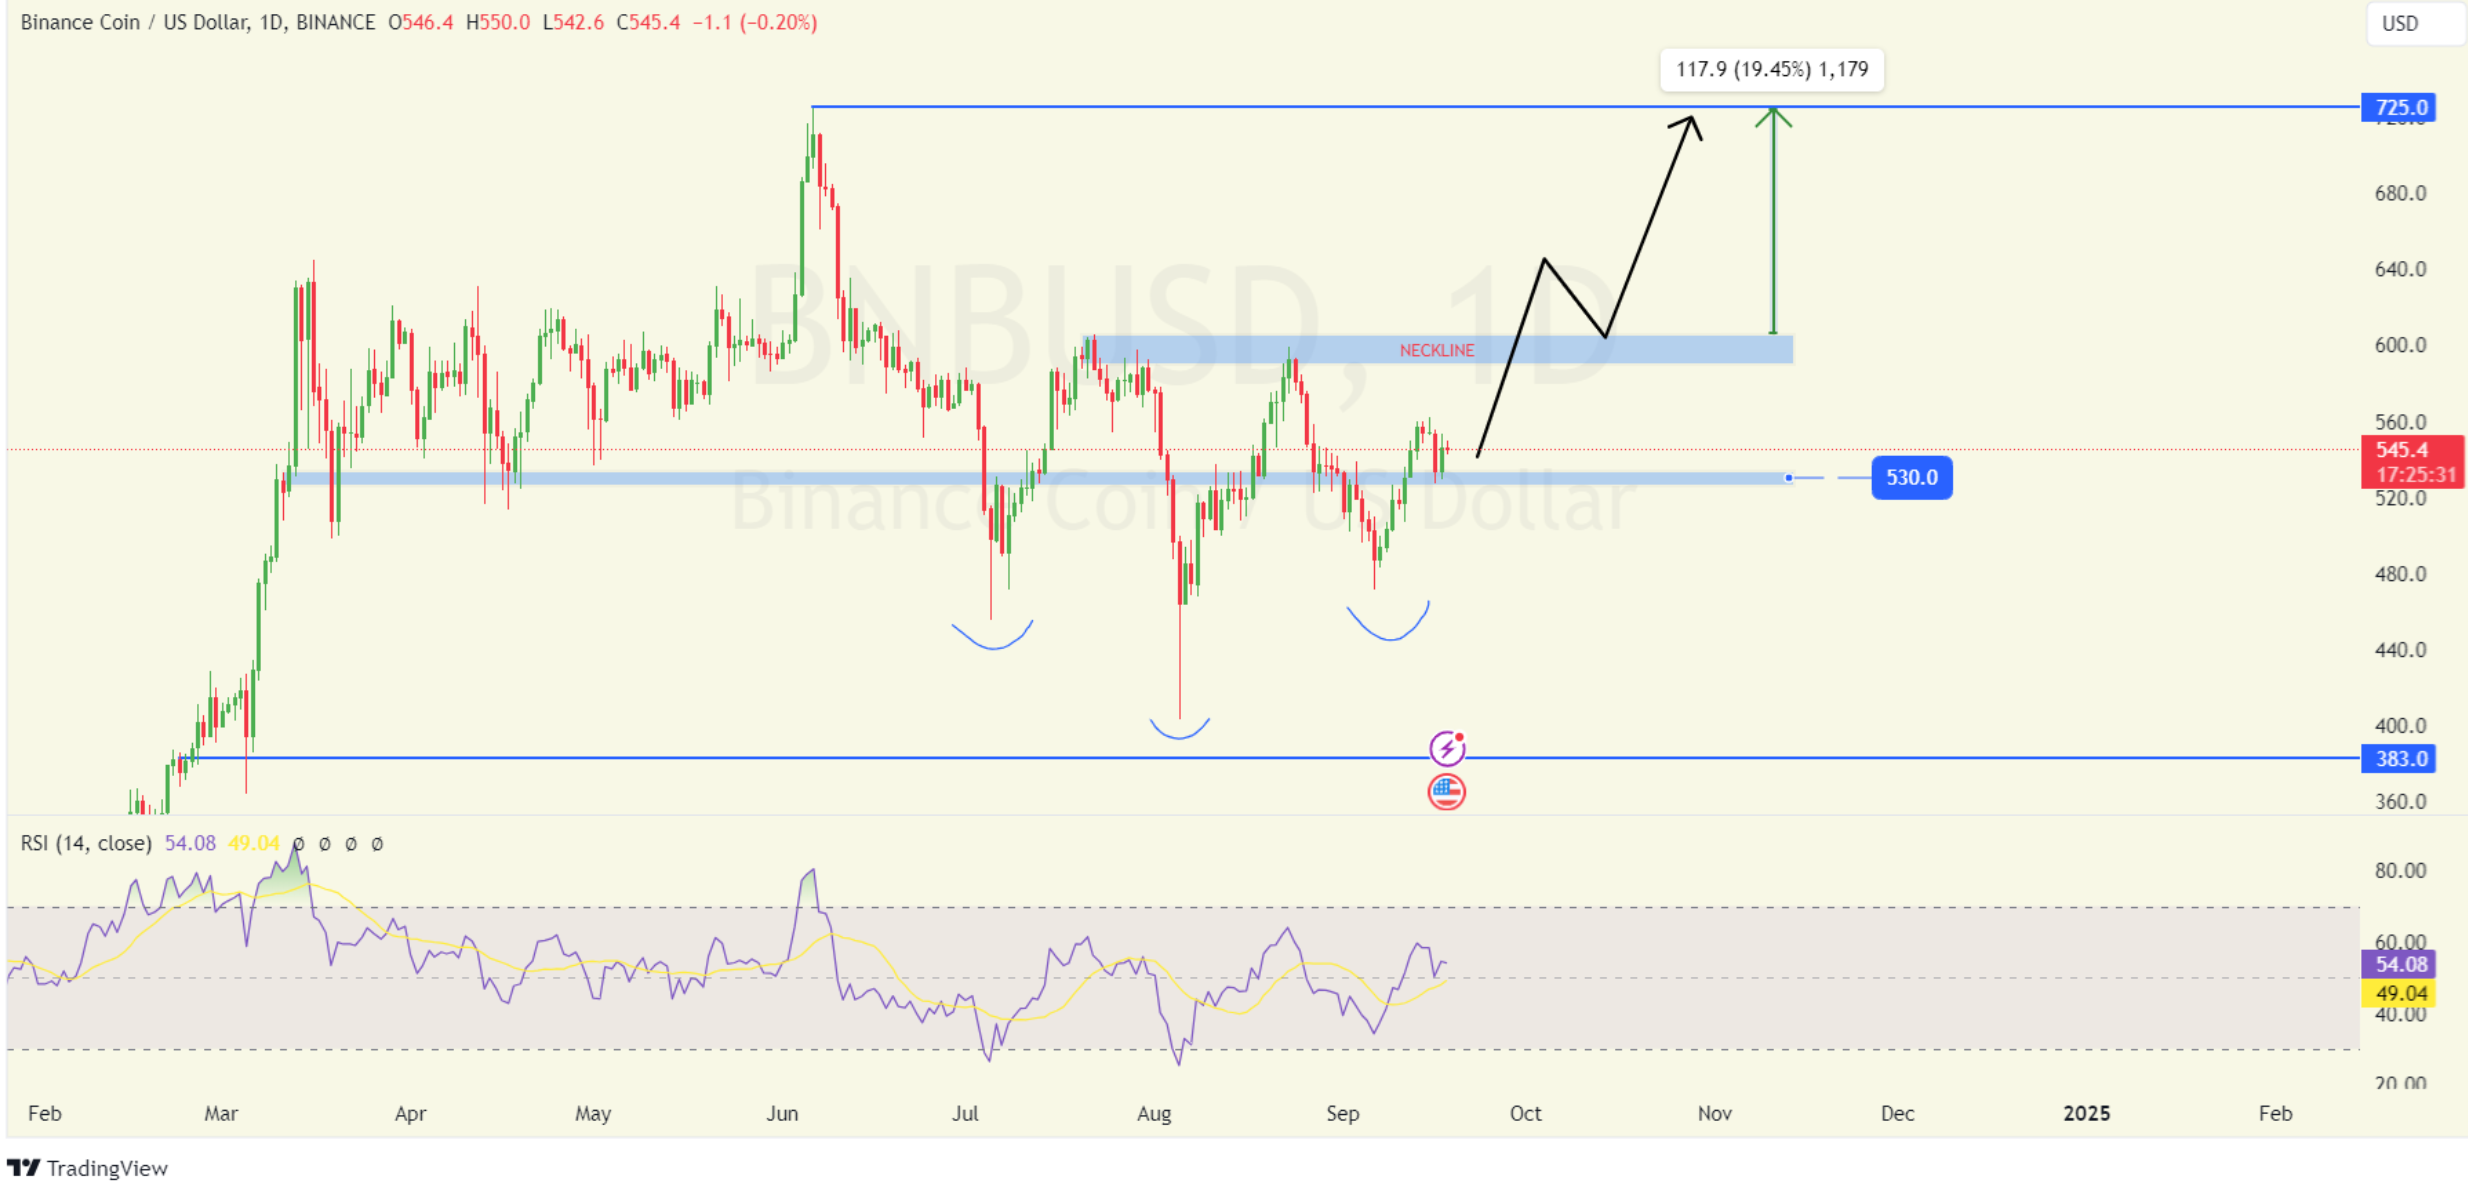
Source: TradingView
RSI and market sentiment
The Relative Strength Index (RSI) is currently hovering around 54, indicating neutral momentum in the market. The RSI neither suggests overbought nor oversold conditions, leaving room for price movement in either direction.
However, since the RSI is slightly above 50, there is a potential for bullish sentiment to grow if buying momentum increases.
Coinglass data shows that as of September 18, 2024, the BNB OI-Weighted Funding Rate is -0.0083%, indicating a slight bearish bias in the market. This funding rate suggests that short positions may have a slight edge. But sentiment could quickly reverse if bulls take control.
BNB was trading at $545.22 at press time, and fluctuations around this price point suggest uncertainty in the market.
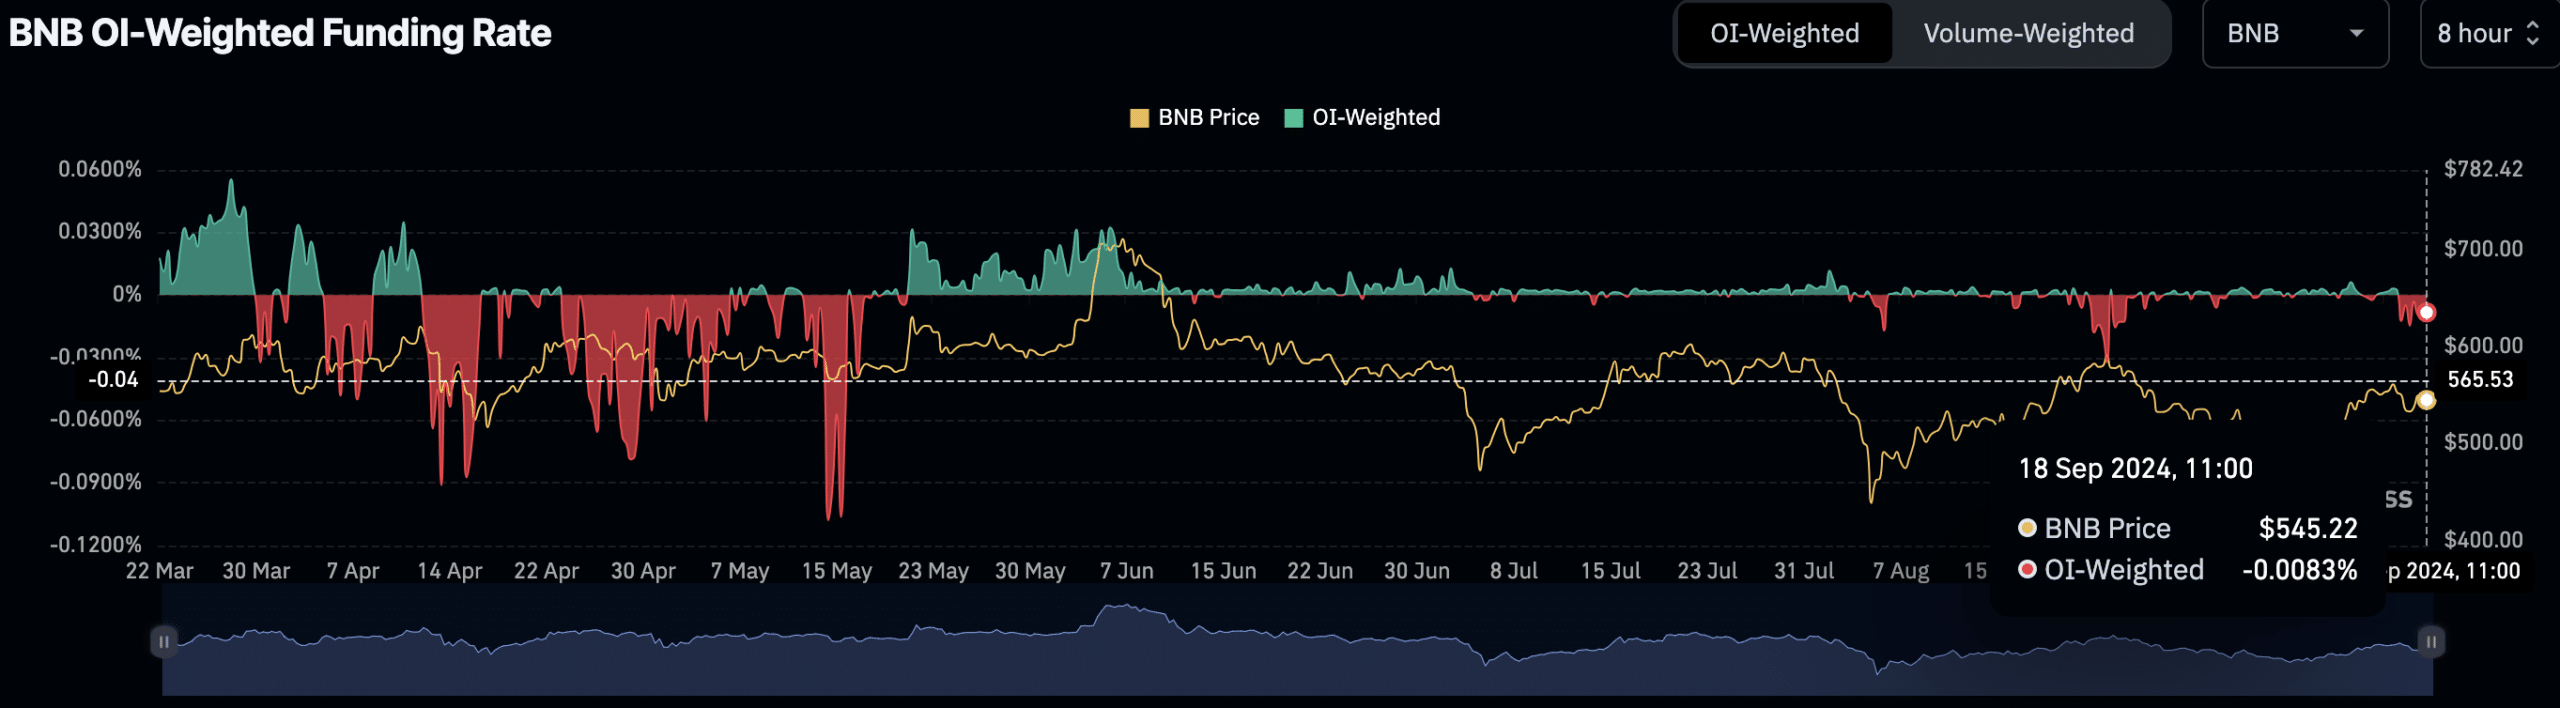
Source: Coinglass
Read Binance Coin’s [BNB] Price Prediction 2024–2025
According to a recent analysis from AMBCrypto, traders can expect a 1:3 risk-to-reward ratio, with an ideal entry point above $545, a target of $600, and a stop-loss around $525.
However, this trade setup will only activate if BNB closes its daily candle above $545, signaling confirmation of bullish momentum.