BONK falls below key level: More losses to follow soon?

- BONK maintains a higher timeframe bullish structure, but is not likely to rally anytime soon.
- The liquidation charts signaled further losses were likely.
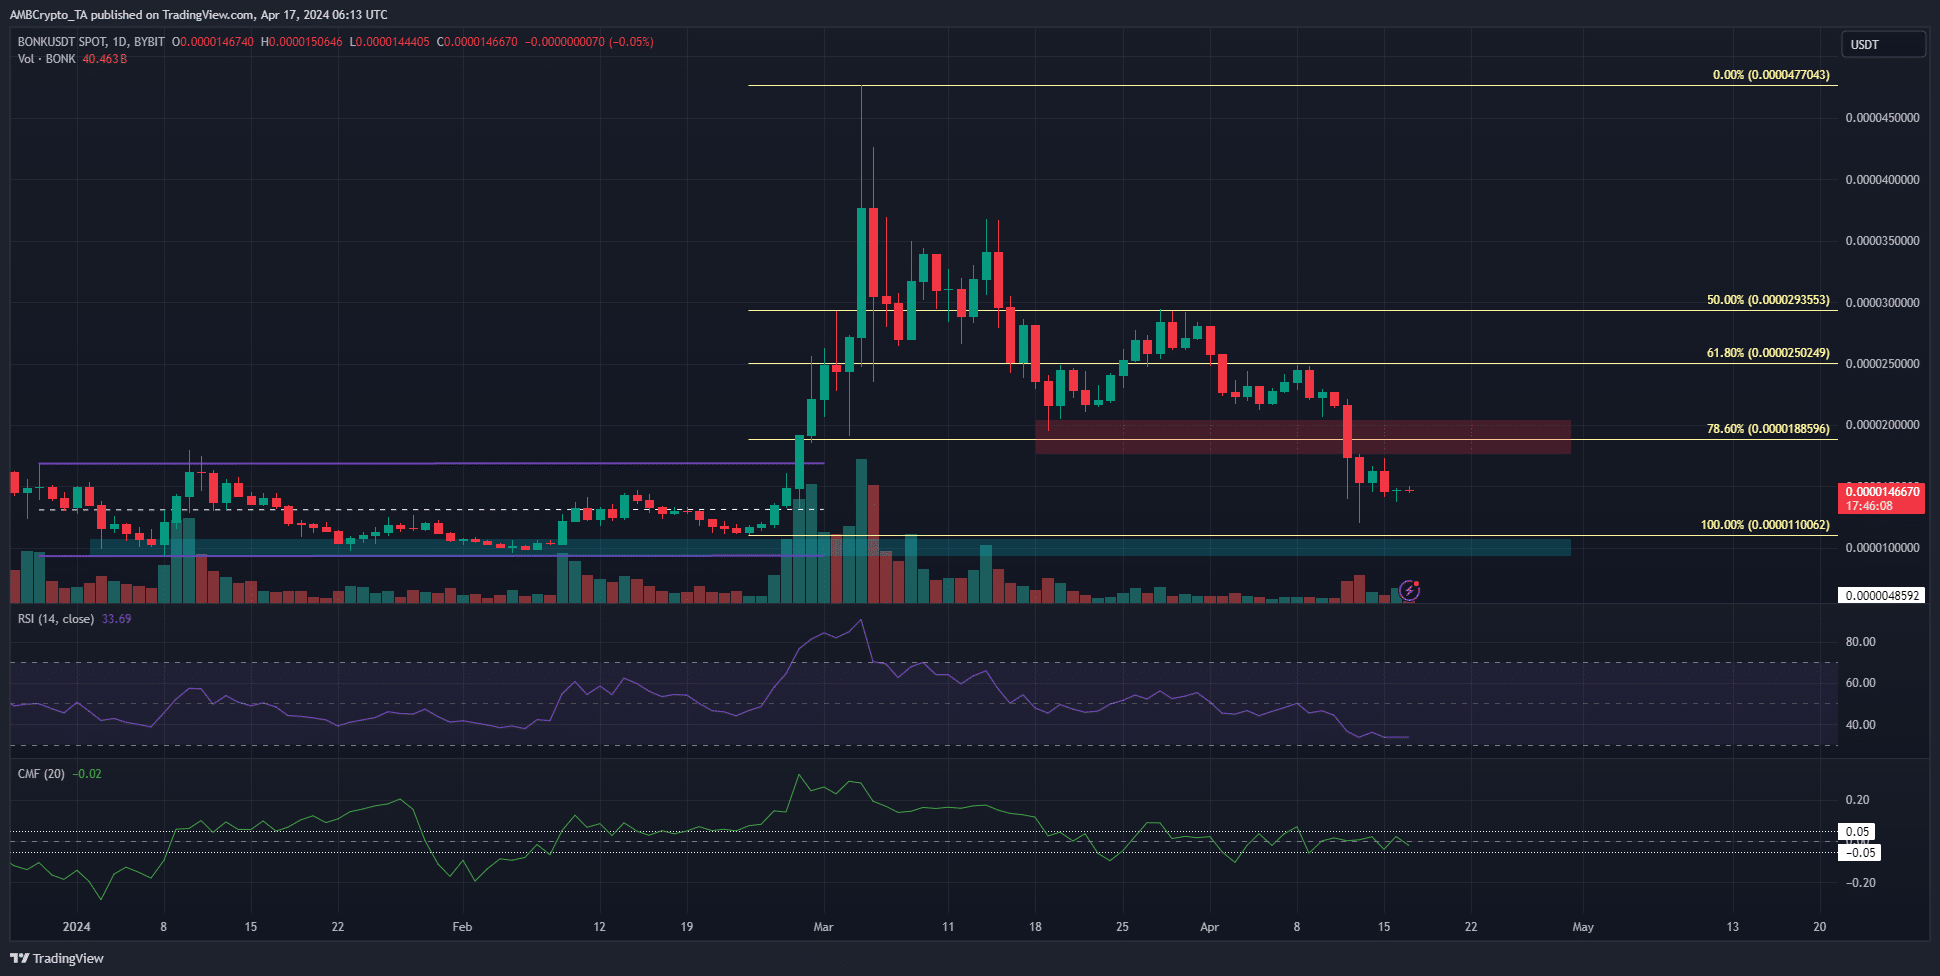
Bonk [BONK] retraced almost all of its gains from the late February-early March rally. It has fallen below the 78.6% Fibonacci retracement level.
As things stand, the meme coin was headed toward the lows of a range that had been active in January.
A recent AMBCrypto report highlighted that key metrics for the token were in decline. Selling pressure has been dominant in recent weeks. Where might the bulls halt these losses?
BONK might need a lot more time to recover
Due to the rally two months ago, the swing low at $0.00001 was still the key swing low on the daily chart. A drop below this level would indicate a long-term downtrend in play.
Yet, the lower timeframes chart showed that the trend has been bearish throughout April.
The inability to climb back above $0.0000293 suggested that a drop was coming. It was expected that the bulls would defend the 78.6% Fibonacci retracement level at $0.0000188.
But this was not to be, and the price was likely headed to the lows of the range (purple) that was in play in January and February.
This could see the meme coin consolidate for a long time before it is ready for the next rally.
The key support zone’s failure drove BONK lower

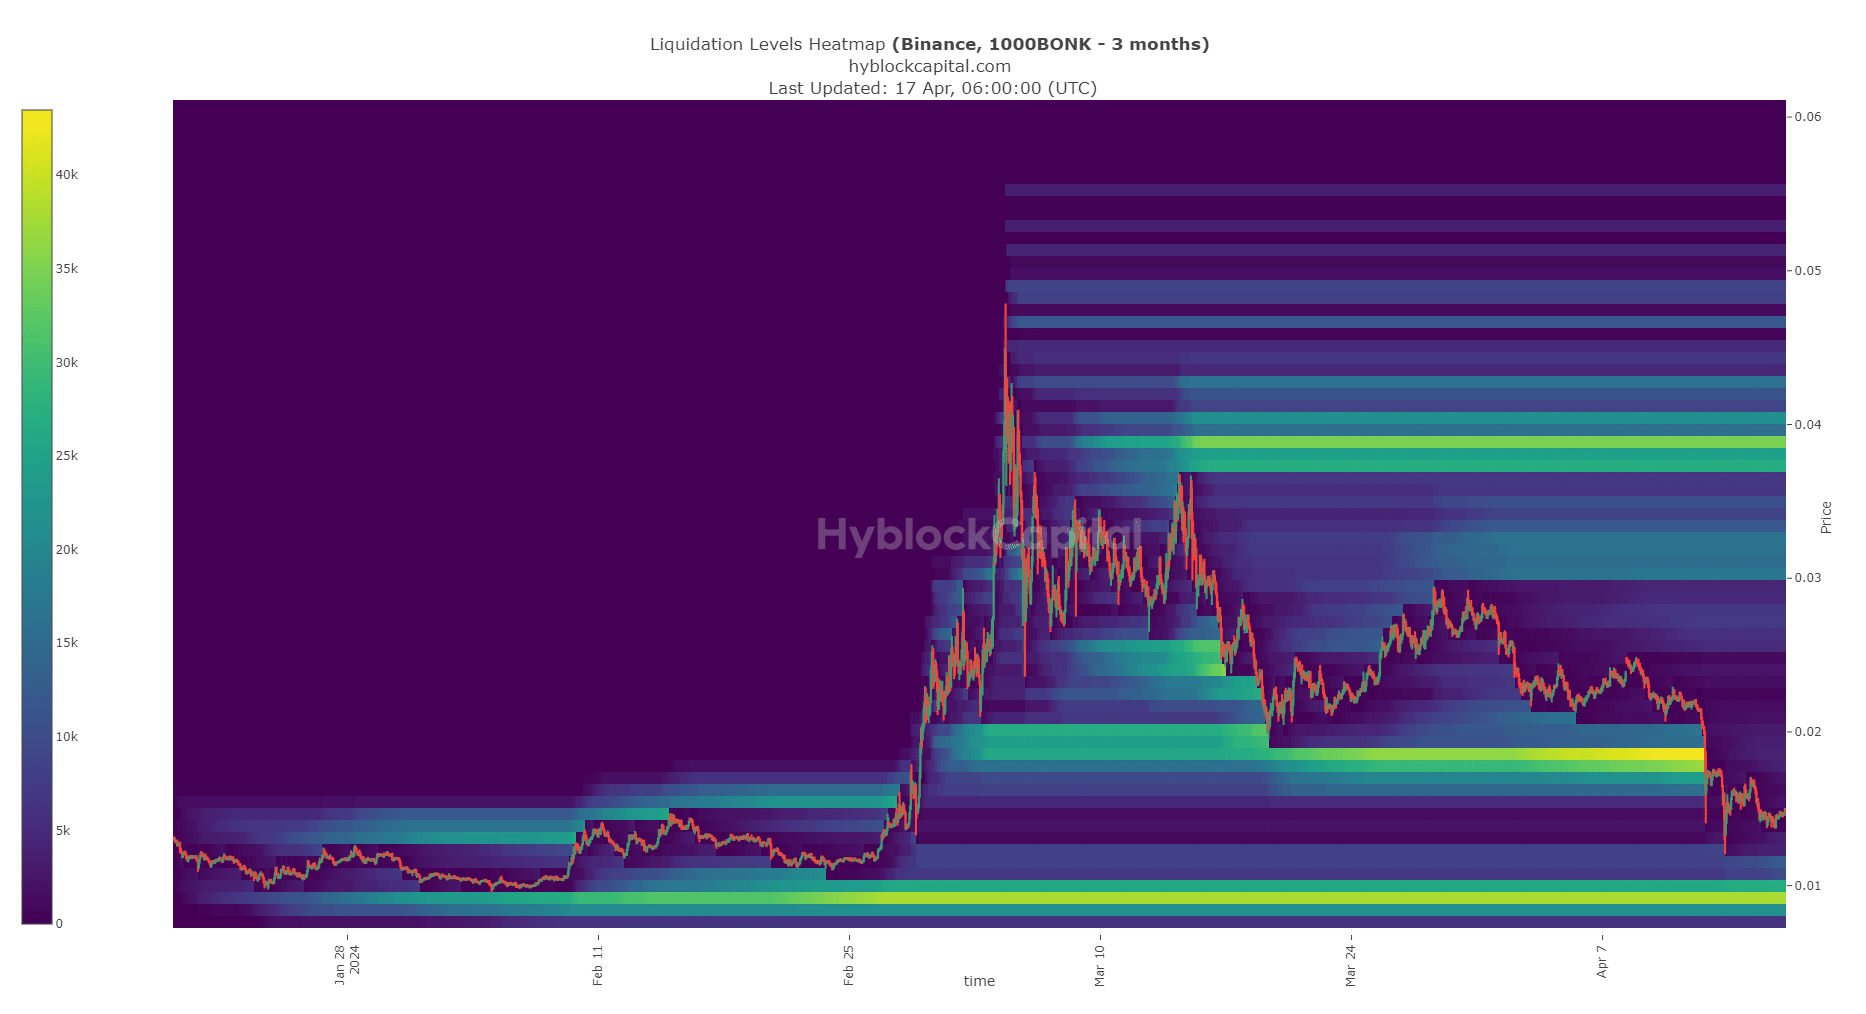
Source: Hyblock
Realistic or not, here’s BONK’s market cap in BTC’s terms
AMBCrypto noted that the key liquidity pocket at $0.0000185 was smashed to bits during the recent drop. The intense selling pressure, combined with the liquidations, forced a liquidation cascade.
The enormous quantity of market sell orders took BONK to $0.0000122 on the 13th of April. The next concentration of liquidation levels was at $0.00000917, marking it as a bearish target.
Disclaimer: The information presented does not constitute financial, investment, trading, or other types of advice and is solely the writer’s opinion.


