BTC’s annual volatility pattern offers insights into this upcoming event
A recent analysis addressed the issue around BTC's volatility and how May-July 2020, 2021, and 2022 have been similar in terms of BTC's volatility trend.

- Bitcoin struggles with low volatility as the bulls and bears are locked in a stalemate.
- A look at both sides of the coin with the prospects of a bullish breakout matched by a potential major crash.
We can all agree that Bitcoin’s price action has been somewhat uneventful lately. But, what if its historic performance contrasted with the current level of volatility may offer some insights into what to expect in the next 2 months?
Is your portfolio green? Check out the Bitcoin Profit Calculator
Bitcoin’s performance in the last seven days underscored low volatility coupled with a liquidity crunch. Recent data suggested that whales were feeling the heat since they feed on liquidity provided by smaller accounts.
Liquidity on both sides of #Bitcoin price is so thin that whales have to either break up their market orders into smaller order sizes to minimize slippage or wait for pockets of liquidity before smashing buttons.
Cranked the Volume Percentile filter way down to see how and… pic.twitter.com/dpXddCKgiX
— Material Indicators (@MI_Algos) May 16, 2023
The above data reflected the current market conditions were underpinned by low volatility. This brings us to the next important observation. According to a recent IntoTheBlock analysis, Bitcoin’s volatility levels as of 18 May stood within a historically significant range.
The analysis also revealed that the volatility metric was below 40%. This time marks the eighth time that it has been that low in the last 5 years.
$BTC volatility reaches historically significant lows.
📉60-day annualized volatility has fallen below 40% for the 8th time in the past 5 years
💰On average $BTC vol remains below this level for 5 weeks and results in a 46% price gain
⚠️However, 3 crashes of 50% have followed… pic.twitter.com/TW8NozgIqE— Sentora (@SentoraHQ) May 18, 2023
Will summer deliver bullish bliss or summon the big bad bear?
An analysis of Bitcoin’s price action between May to July 2020, 2021, and 2022 revealed something worth noting. There was a drop in volatility within those three months in each of those years, followed by a noteworthy rally. So far things have turned out somewhat similar this year considering the currently low volatility.
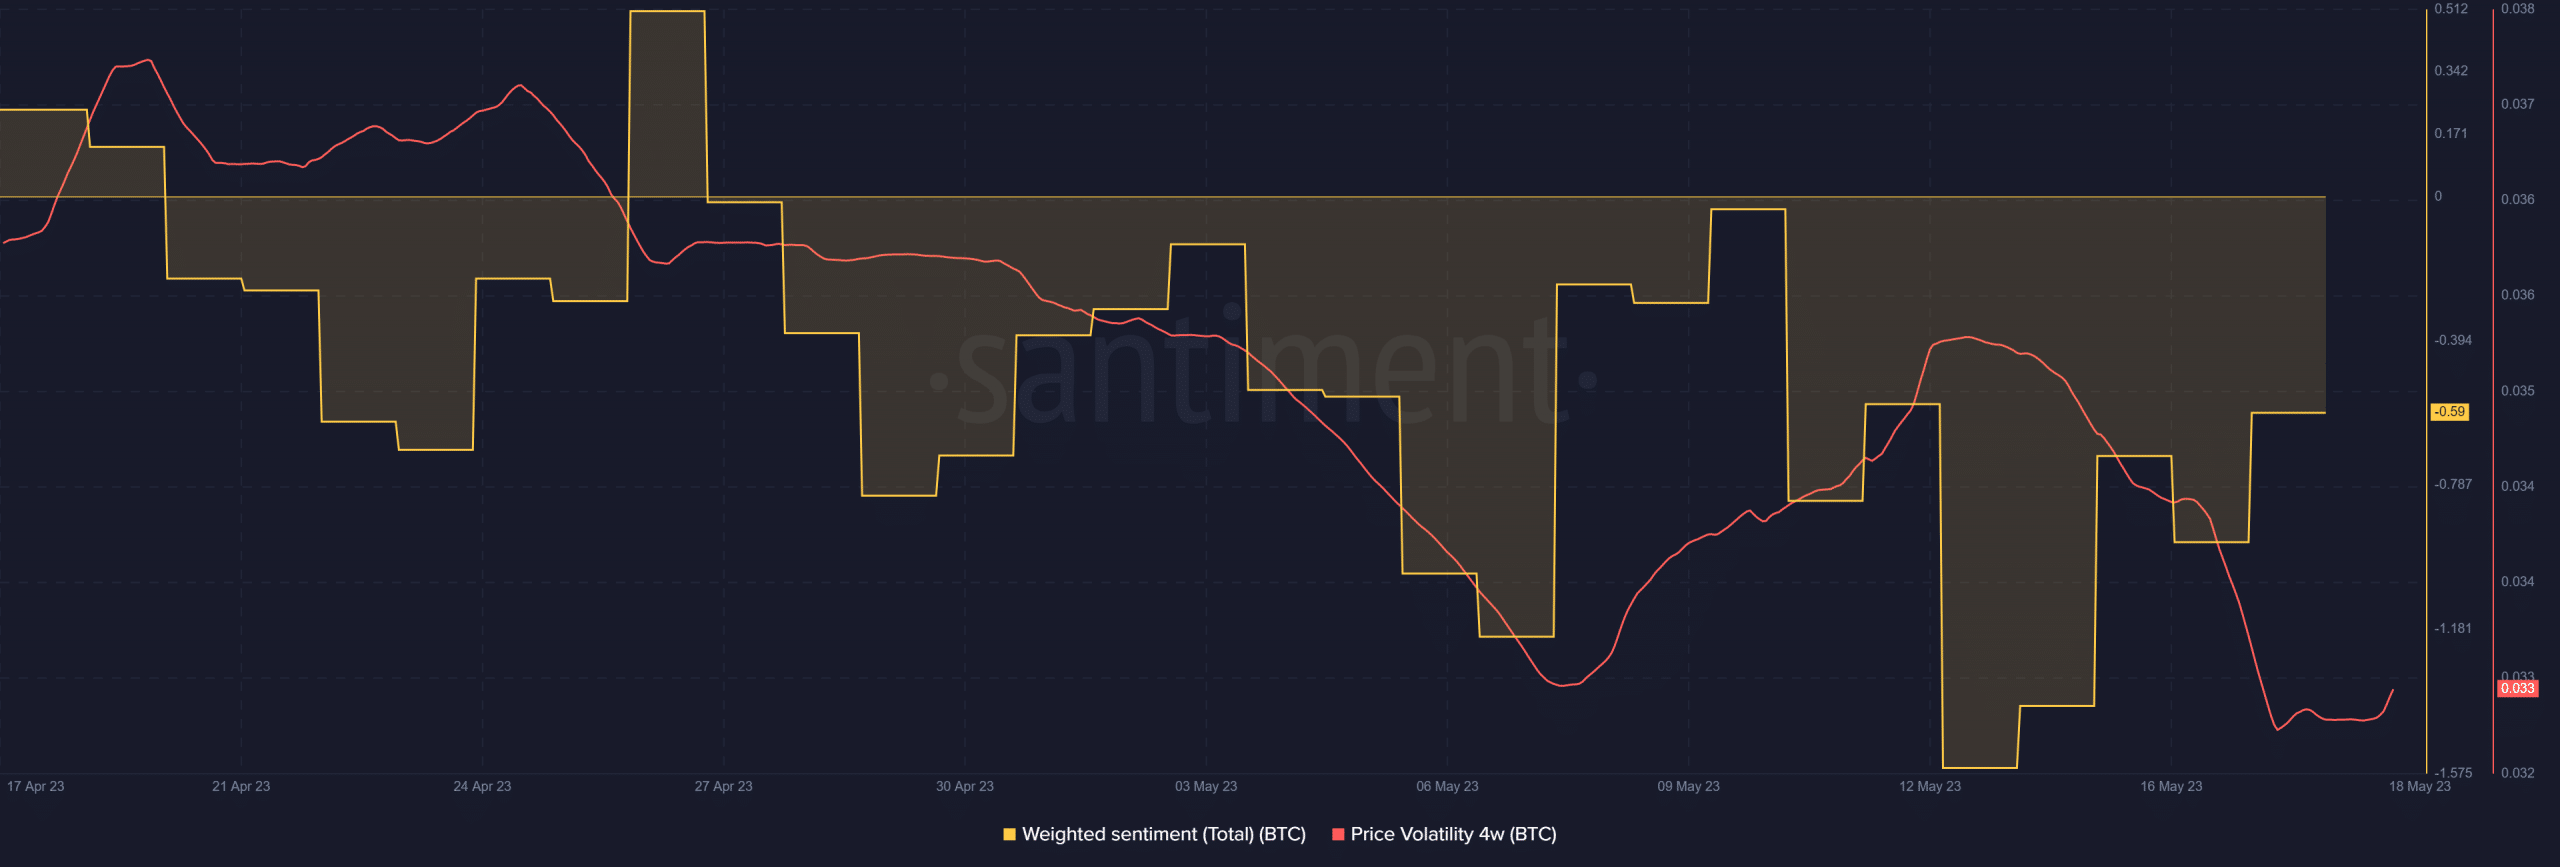
Investor sentiment has also been on an overall downward trajectory during the last four weeks. But does this mean that Bitcoin is about to enjoy a bullish explosion within the next 8 weeks? The same IntoTheBlock analysis revealed that the low volatility below 40% lasts for roughly five weeks on average and that there has been a 50% downside after that on three similar occasions.
Read Bitcoin’s [BTC] price prediction 2023-24
If BTC is indeed due for a 50% crash from the current level, it would go it as low as the $13,500 price range. Remember the probability may be low but never zero.
There is a lot that determines Bitcoin’s price outcome. For example, BTC was still experiencing bullish volumes which means there was still some level of confidence in the market. Its on-chain volume went up slightly in the last four days.
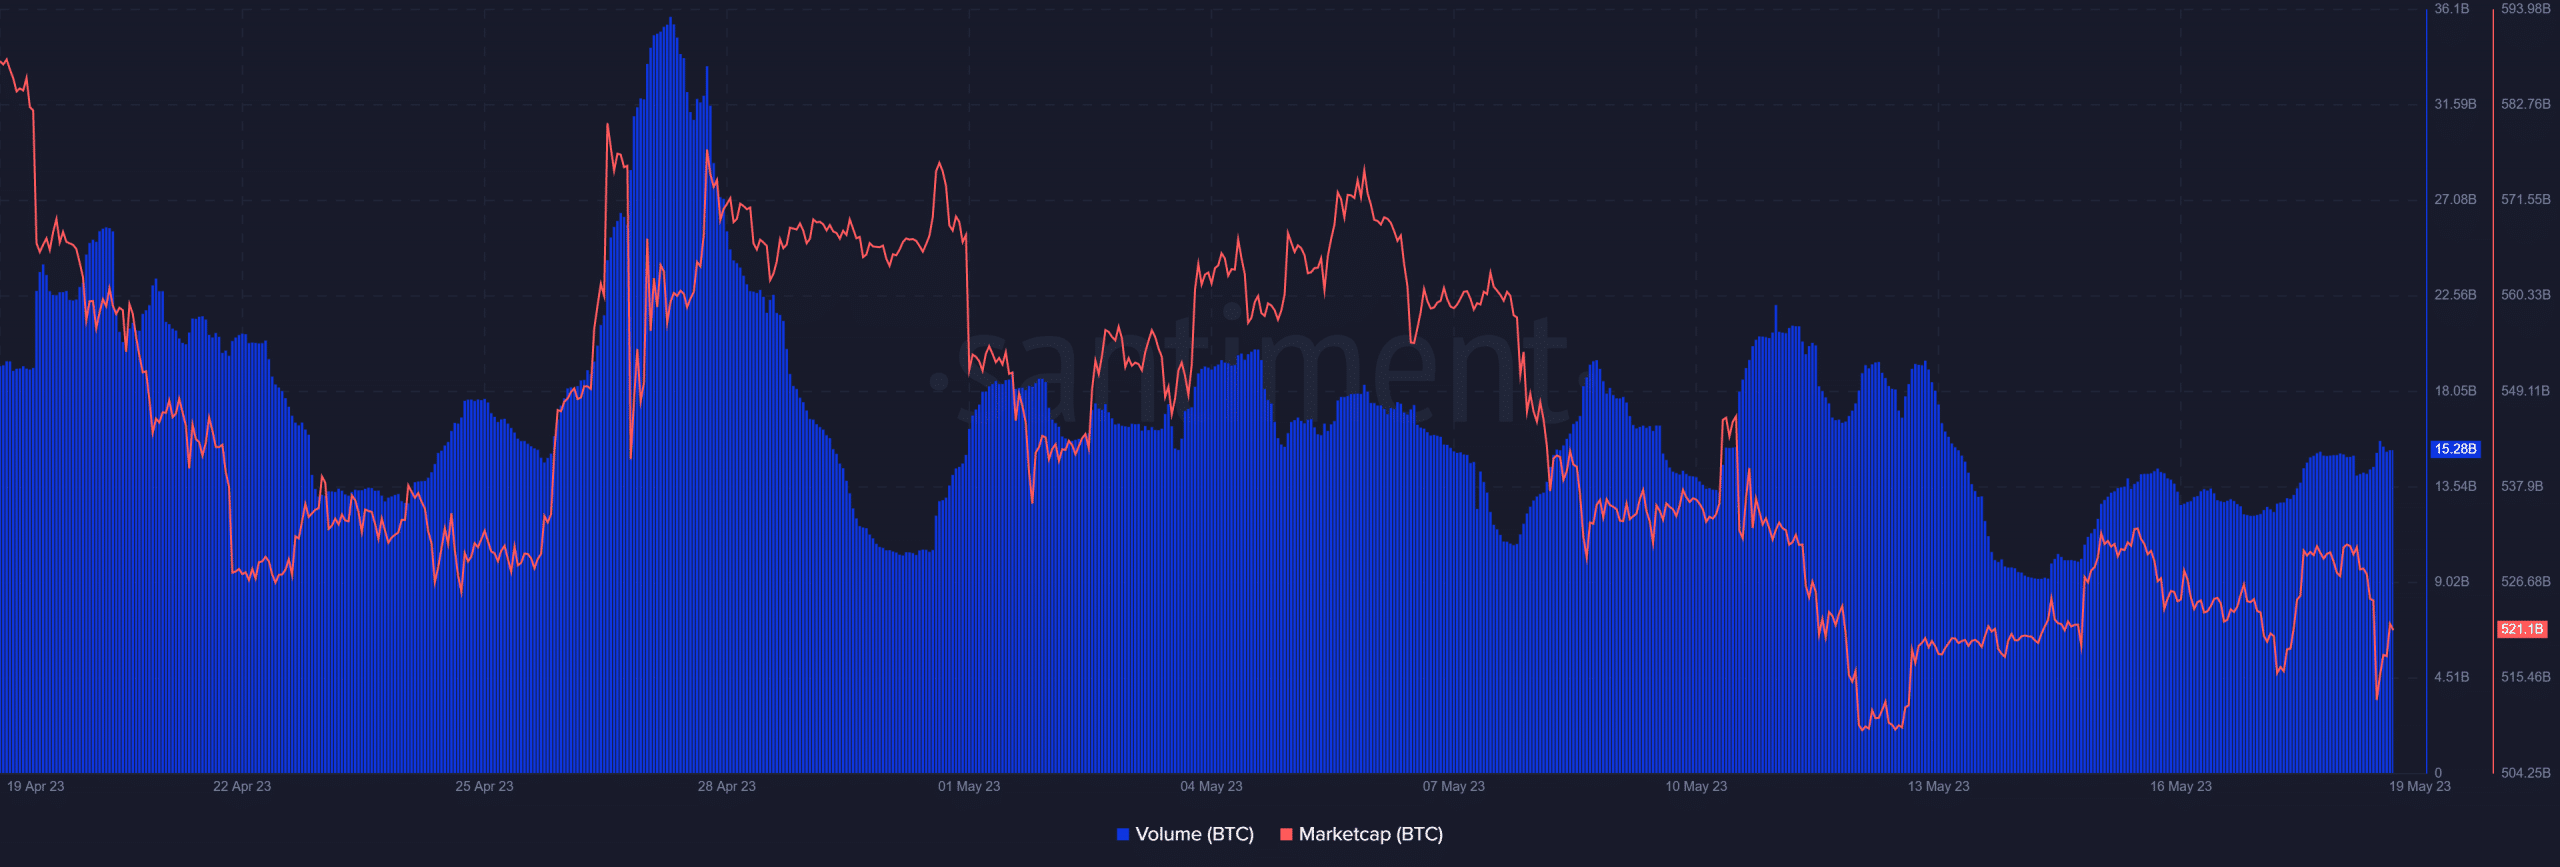
We know it was predominantly bullish volume initially because Bitcoin’s marketcap went up by as much as $21 billion between 12 and 18 May. A strong wave of sell pressure wiped out a substantial amount of that gained marketcap, suggesting that short-term profit-taking is still active.
One can only wait and see whether these conditions will dampen sentiments further and cause another major crash, or trigger the next wave of accumulation.