CAKE enthusiasts can look for these signs to maximize gains on their investments

- Santiment analyst Clementllk opined that CAKE’s price was approaching a good buying opportunity.
- An assessment of the altcoin on a daily chart revealed growing accumulation.
In a 7 January report by Santiment, pseudonymous analyst Clementllk, in an assessment of PancakeSwap’s CAKE token, revealed that the altcoin reached a technical price pattern. This pattern historically indicated a high success rate for buying opportunities.
How many CAKEs can you get for $1?
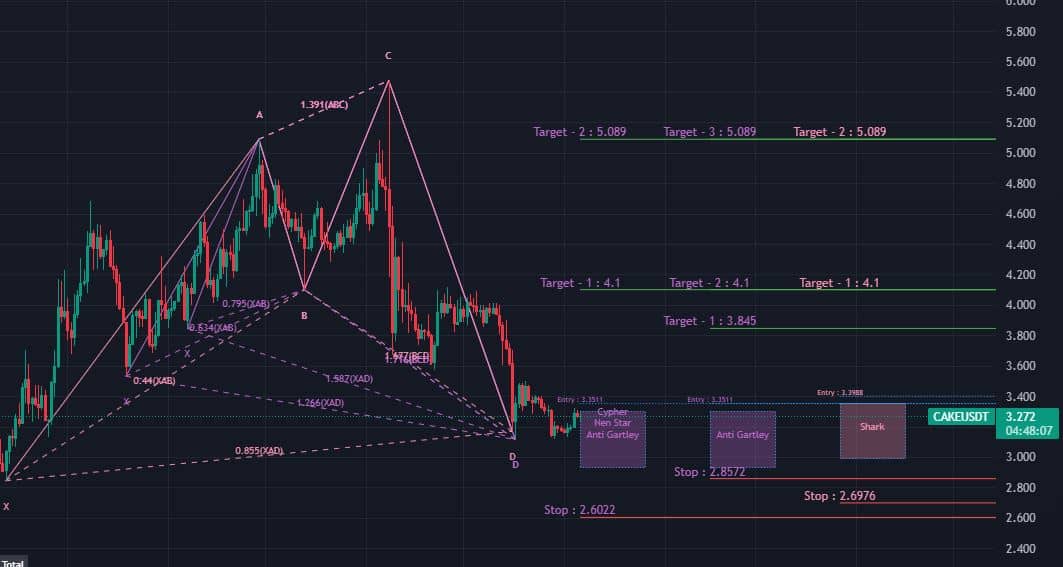
Clementllk assessed CAKE’s movement on a price chart and found that the native token of the leading decentralized finance protocol (DeFi) on BNB Chain was forming a shark pattern. According to Clementllk, if CAKE hits the price mark of $3.45, the pattern will be successfully triggered.
It would thus create a good buying opportunity for investors.
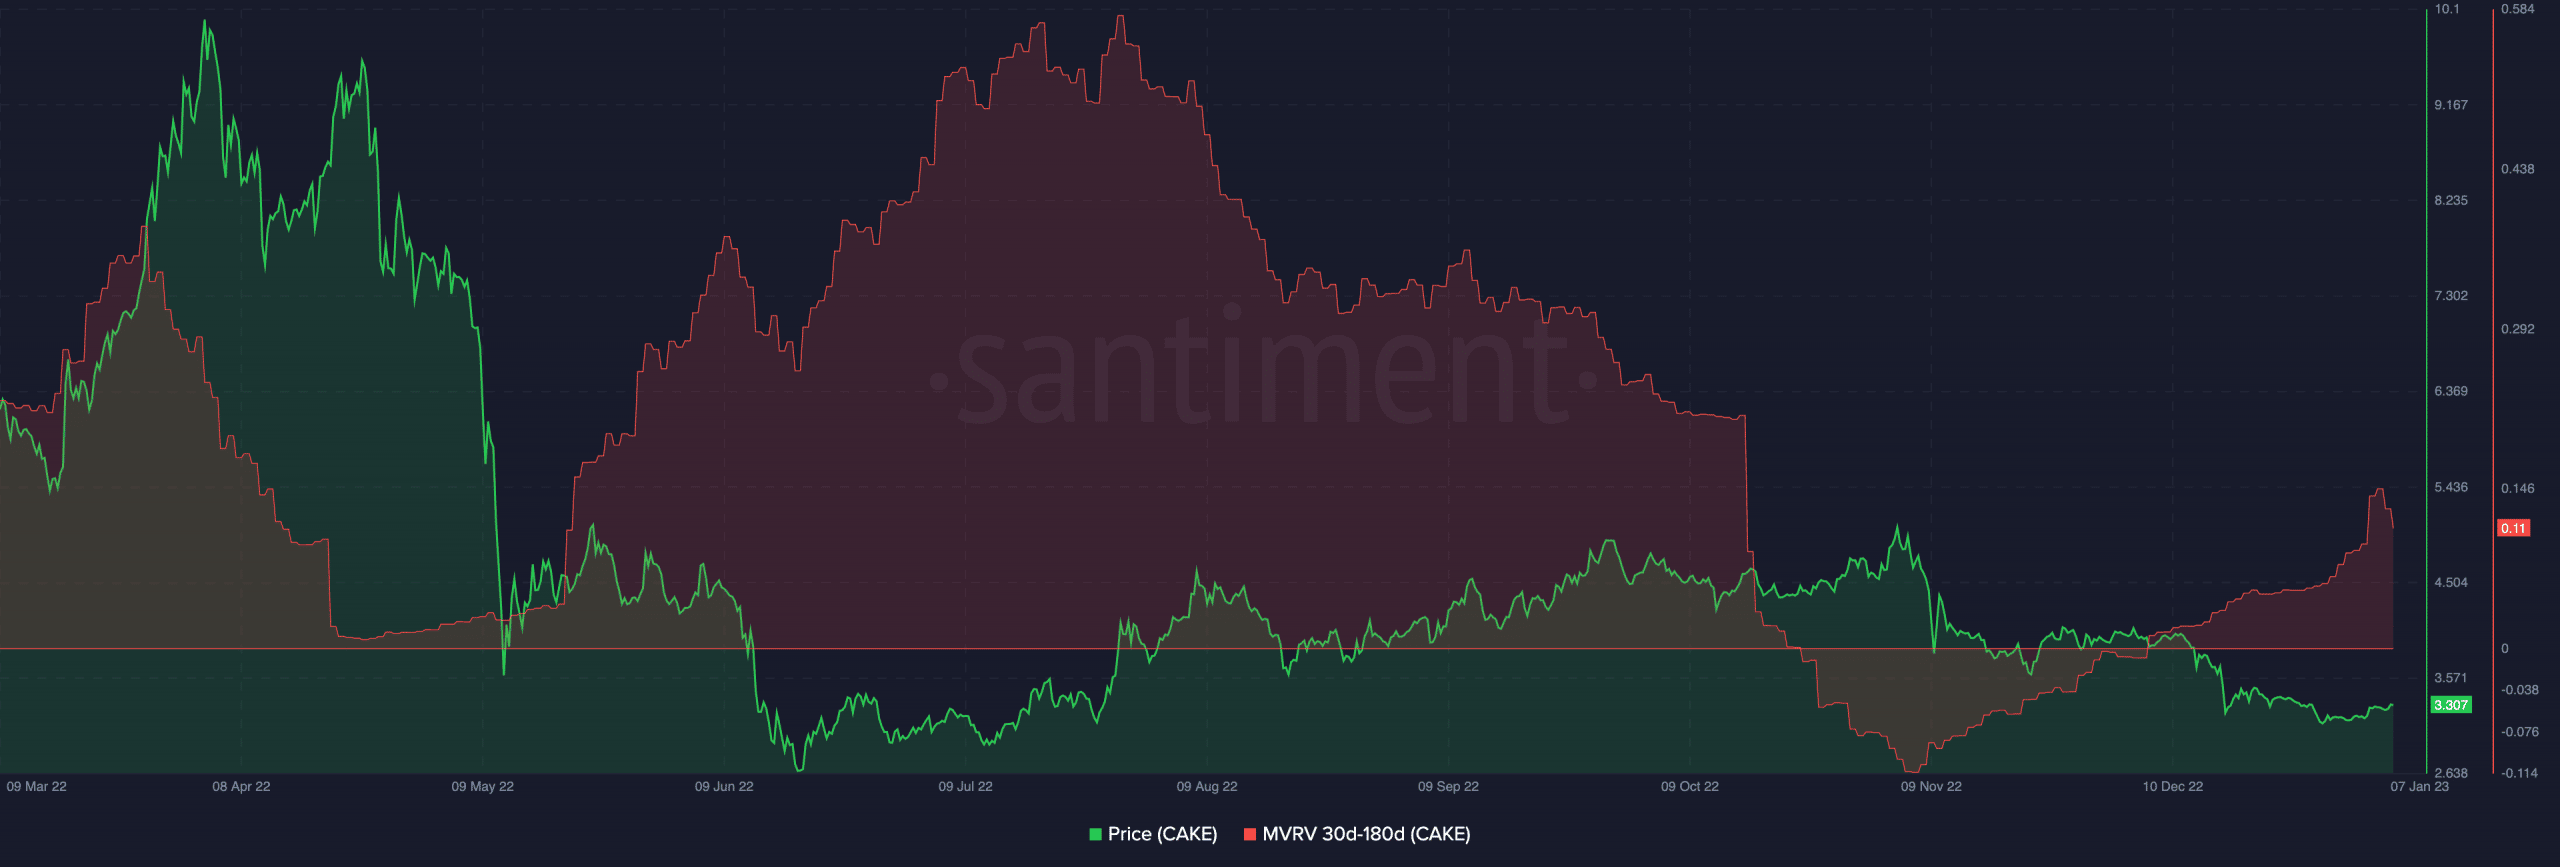
Further, the analyst assessed CAKE’s Market Value to Realized Value (MVRV) ratio using two formulas, including the {(MVRV 90d / 30d)-1} and (MVRV 30d-MVRV180d). While the first formula returned a negative MVRV ratio, the latter returned a positive value.
Clementllk opined that this could be a “potential buying opportunity” for the investors looking to ape in on the altcoin. As of this writing, CAKE’s (MVRV30d-MVRV180d) remained positive at 0.11, data from Santiment revealed.
What should CAKE holders expect?
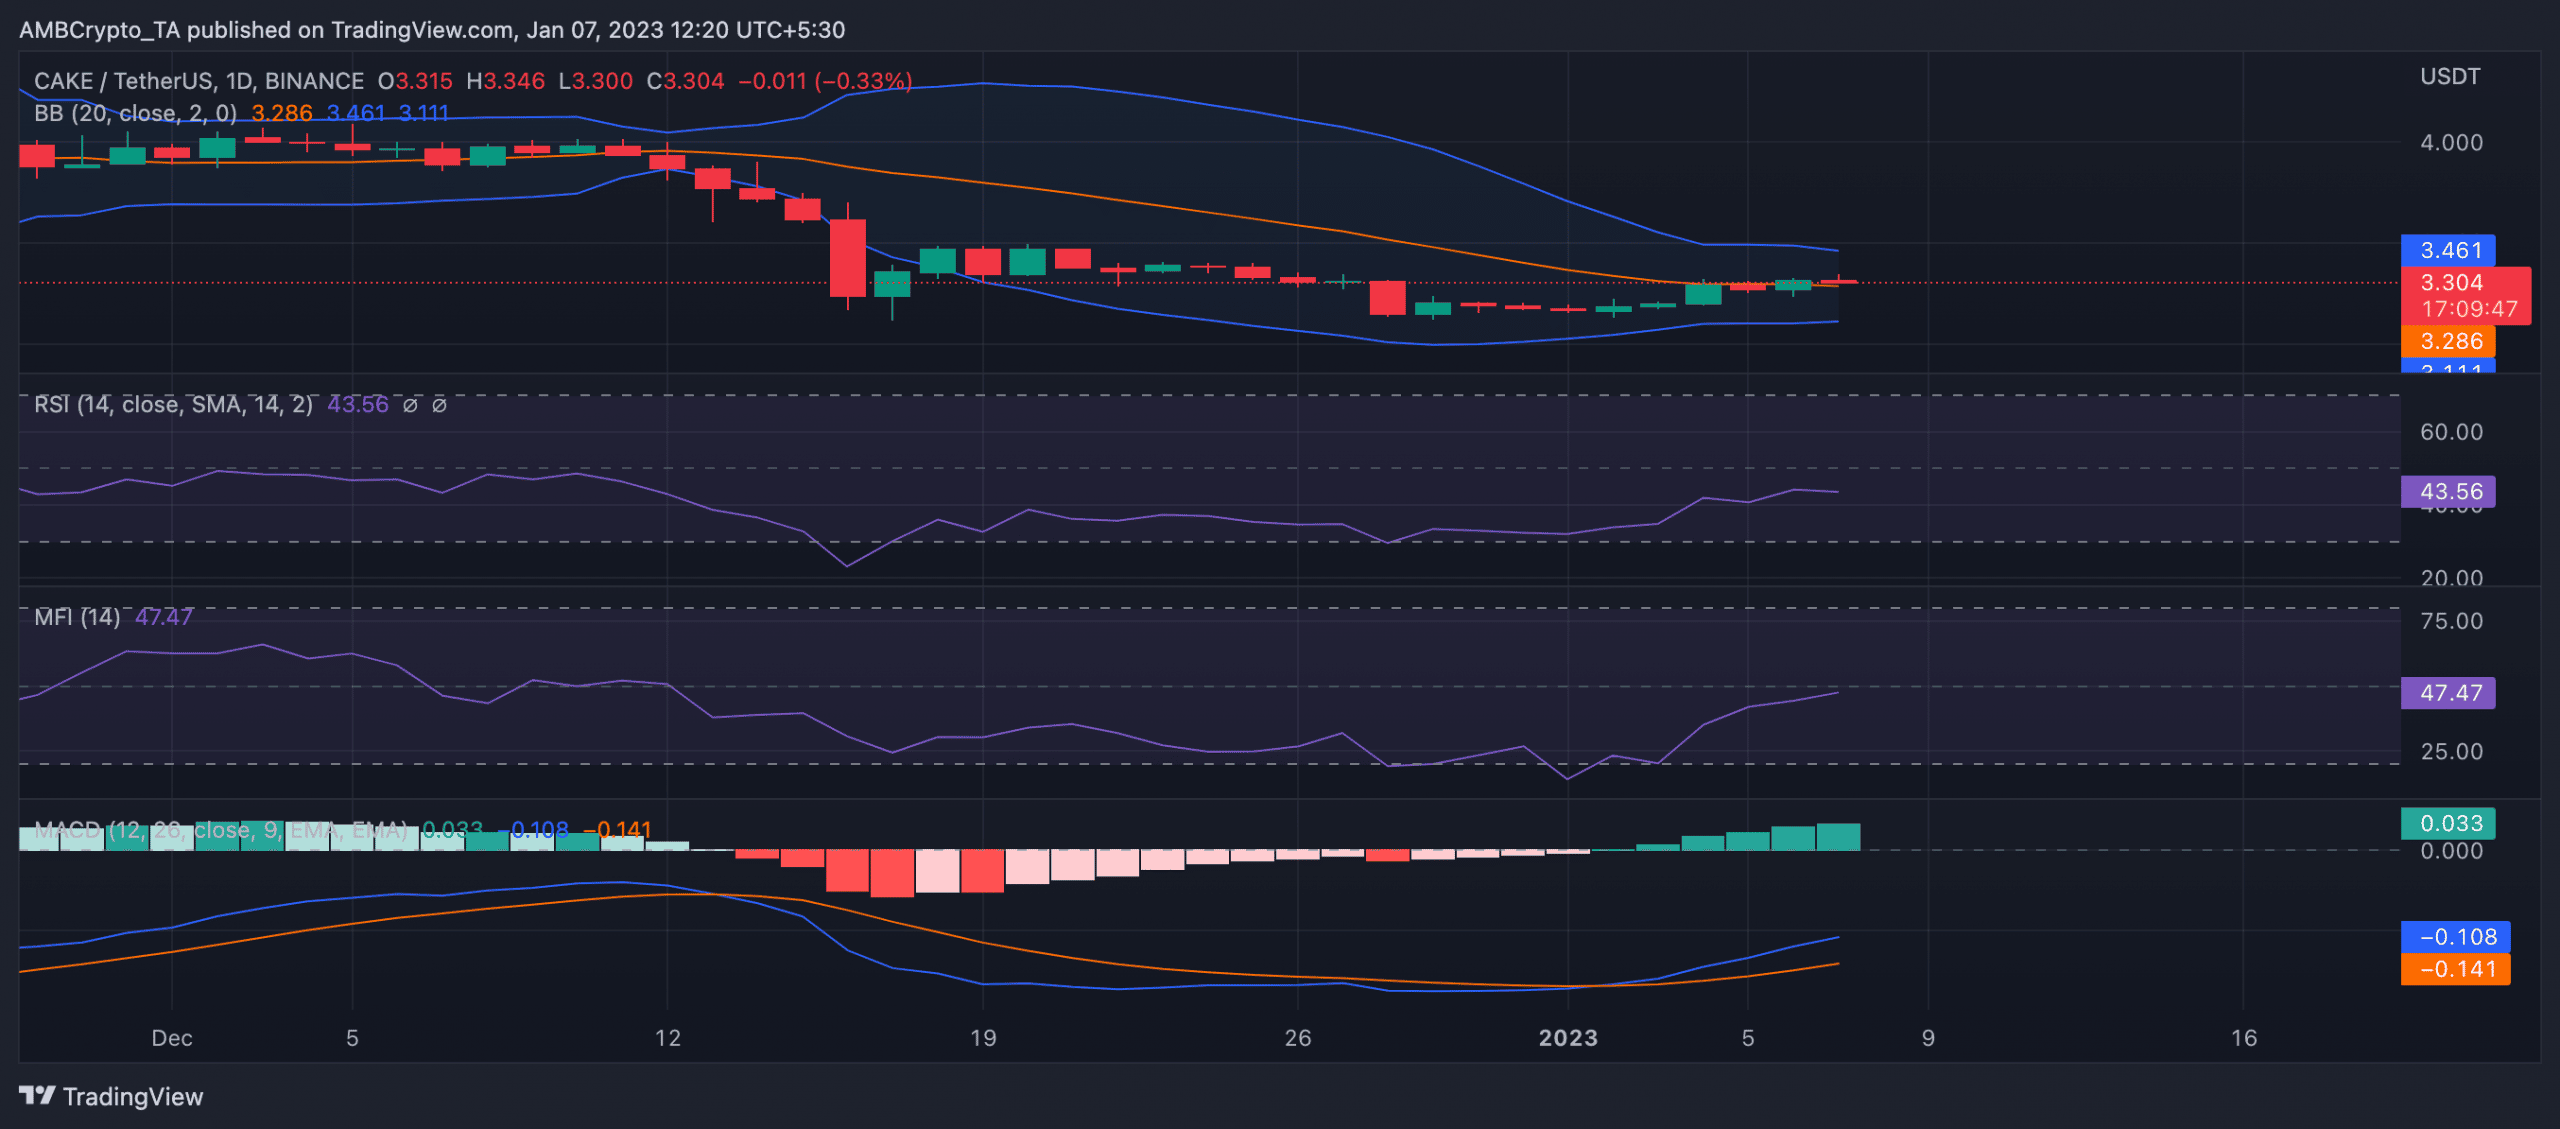
CAKE commenced the 2023 trading year with a new bull cycle, a price movement assessment on a daily chart revealed. A look at the position of the Moving Average Convergence Divergence (MACD) line relative to the signal line confirmed this.
On 2 January, the MACD line intersected the signal line in an uptrend. This is typically considered a bullish sign, indicating that a new uptrend is beginning. This was validated by CAKE’s price growing by 4% until press time.
Since the new bull cycle began, CAKE has become increasingly less volatile. A look at the alt’s Bollinger Bands (BB) revealed this.
Read PancakeSwap’s [CAKE] Price Prediction 2023-24
The distance between an asset’s BB bands (upper and lower bands) can be used to gauge market volatility. When the distance between the bands is wide, it could indicate that the market is highly volatile. Conversely, when the distance between the bands is narrow, it could suggest that the market is less volatile.
On a daily chart, for CAKE, the distance between the two bands has narrowed progressively since the year began.
Although still positioned below their respective neutral zones at press time, CAKE’s Relative Strength Index (RSI) and its Money Flow Index (MFI) have been on an uptrend since the beginning of the new bull cycle. This indicated that buying activity has since grown.
However, with CAKE’s price in between the upper and lower bands of its BB, this indicated that the market was in a state of consolidation or indecision.
When the price is in the middle of the bands, it could mean that the market is waiting for a catalyst or new information to come out before making a move.
It could also indicate that there is an equal number of buyers and sellers in the market, and neither side is able to gain the upper hand, resulting in the asset’s price remaining relatively stable.