Can Bitcoin’s struggles and volatility of Q3 overshadow BTC’s Q4 performance
The third quarter (Q3) of 2022 has been one filled with intense scrutiny of crypto assets with Bitcoin [BTC] at the heart of it. The king of crypto asset, recently, witnessed a dip in its tractions due to developments on major blockchains such as Ethereum [ETH] and Cardano [ADA].
However, BTC still remains the largest market cap crypto asset by a country mile. While the coin’s price dipped again in the previous quarter, another strange pattern was observed from the on-chain data.
Old BTC, new story
BTC witnessed a price slide in recent months on the back of sustained macro pressure. Another major sell-off was initiated last week after the Ethereum Merge was launched. However, in light of these events BTC witnessed a downward volatility trend. The average 30-day volatility for August 2022 saw a 20% dip from the 80% observed in June.
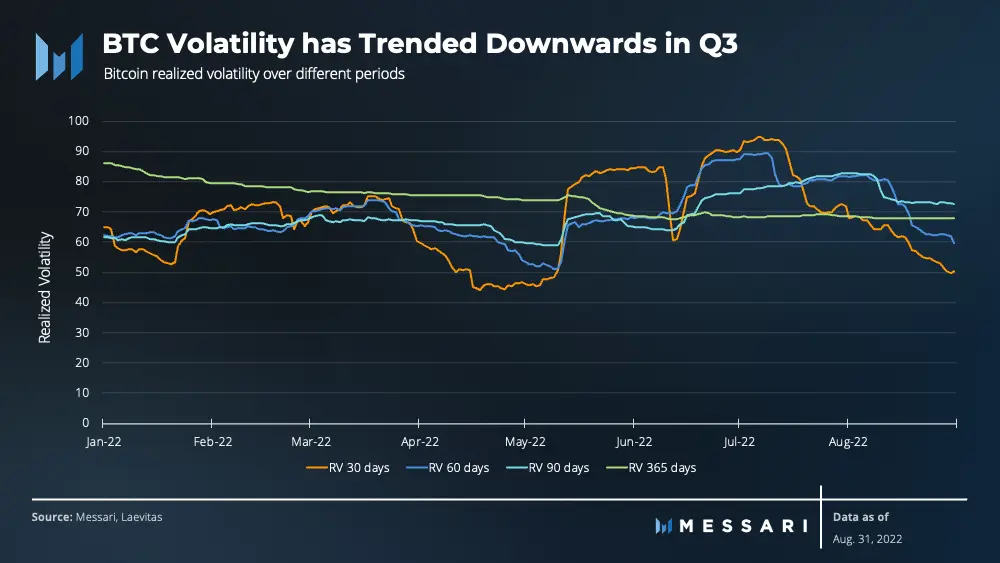
One of the foremost impact of decreasing volatility of Bitcoin prices was pointed out by Messari in a recent report. A lower Bitcoin volatility resulted in lower liquidations across the larger crypto market.
In total, long liquidations in August 2022 amounted to over $5 billion, which is less than half as seen in June ($10.8 billion). The total short liquidations were also significantly lower. During August, short liquidations recorded around $3.5 billion as compared to over $6.6 billion in June.

A network conundrum
With the shifts in place, the BTC network also underwent certain transitions in the previous quarter. Additionally, there has also been a slowdown in funded addresses for the network. In Q3 2022, funded addresses only grew by 1.1% compared to 2.5% in Q2 2022. Moreover, the number of funded addresses experienced its first decline in August 2022 after 10 months of growth.
The network also witnessed a 4% dip in average daily active addresses that clocked at 890,000 as compared to Q2 2022. However, Messari stated that,
“Active addresses seem to have returned to their baseline of activity, after the cycle peaked in Q4 2021 along with the prices.”
 Source: Messari
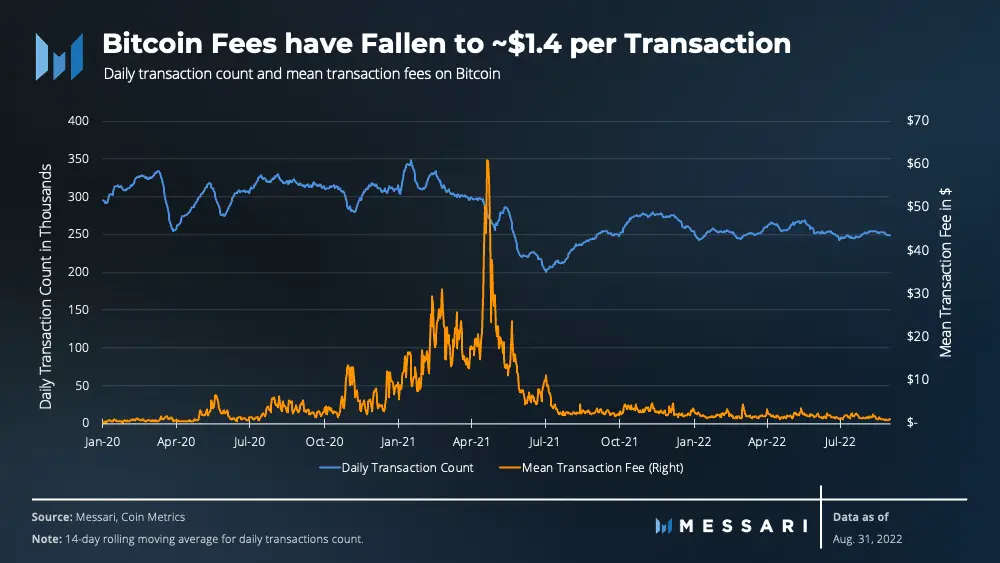
One similar story for BTC from the previous quarter was that daily transactions largely remained unchanged. In fact, they continued to record over 250,000 daily transactions over the year. However, a dip was seen in average transaction fees as the average fee per transaction dropped by 21% to $1.4.
At the time of writing, BTC stood in a state of intense speculation in the crypto community over its future. The BTC price also exchanged hands below $18,900 with sellers having the upper hand for the past week now.
This movement put BTC’s weekly losses at 7% as it struggles in the bear market.


