Can Chainlink break out past the near-term supply area at $18

Disclaimer: The findings of the following analysis are the sole opinions of the writer and should not be considered investment advice
A longer-term outlook for Chainlink remained bearish – the $19.67 and $22-levels remain unbroken. On lower timeframes, a recovery back towards these levels appeared possible. Bitcoin registered some gains in recent days. Moreover, Bitcoin’s Dominance fell from 43.05% to 42.26% at the time of writing, which suggested that altcoins were making gains alongside Bitcoin.
Chainlink broke the $16.6 highs that had acted as strong resistance to the price over the past couple of weeks. Was it a short-term uptrend gathering strength?

The $16.6-level marked the highs of a bounce from the $13.56-lows. A set of Fibonacci retracement lines were plotted based on the highs before the market-wide sell-off (but still a lower high in a longer-term downtrend) at $22.98, and the swing low at $13.56. This showed that the $15.78 and $17.16 were levels of short-term importance. Over the past few days, the price has climbed above the 23.6% retracement level and has also retested $16.6 in search of buyers.
This showed that, in the short term, the market structure was bullish. The $18 higher high (red box) area was a place where supply was found. At the time of writing, the price made consistent higher lowers (white trendline), which showed buyers were ready to buy even as the price approached a resistance zone.
A breakout past the $18-area and a retest would be a buying opportunity. The $17.4-level has held significance in the past, and flipping this level to support would bolster LINK’s chances of a move upwards to $19.6.
Rationale
The 21-period moving average (orange) formed a bullish crossover above the 55-period SMA (green), and both these moving averages offered some support to the price over the past couple of days.
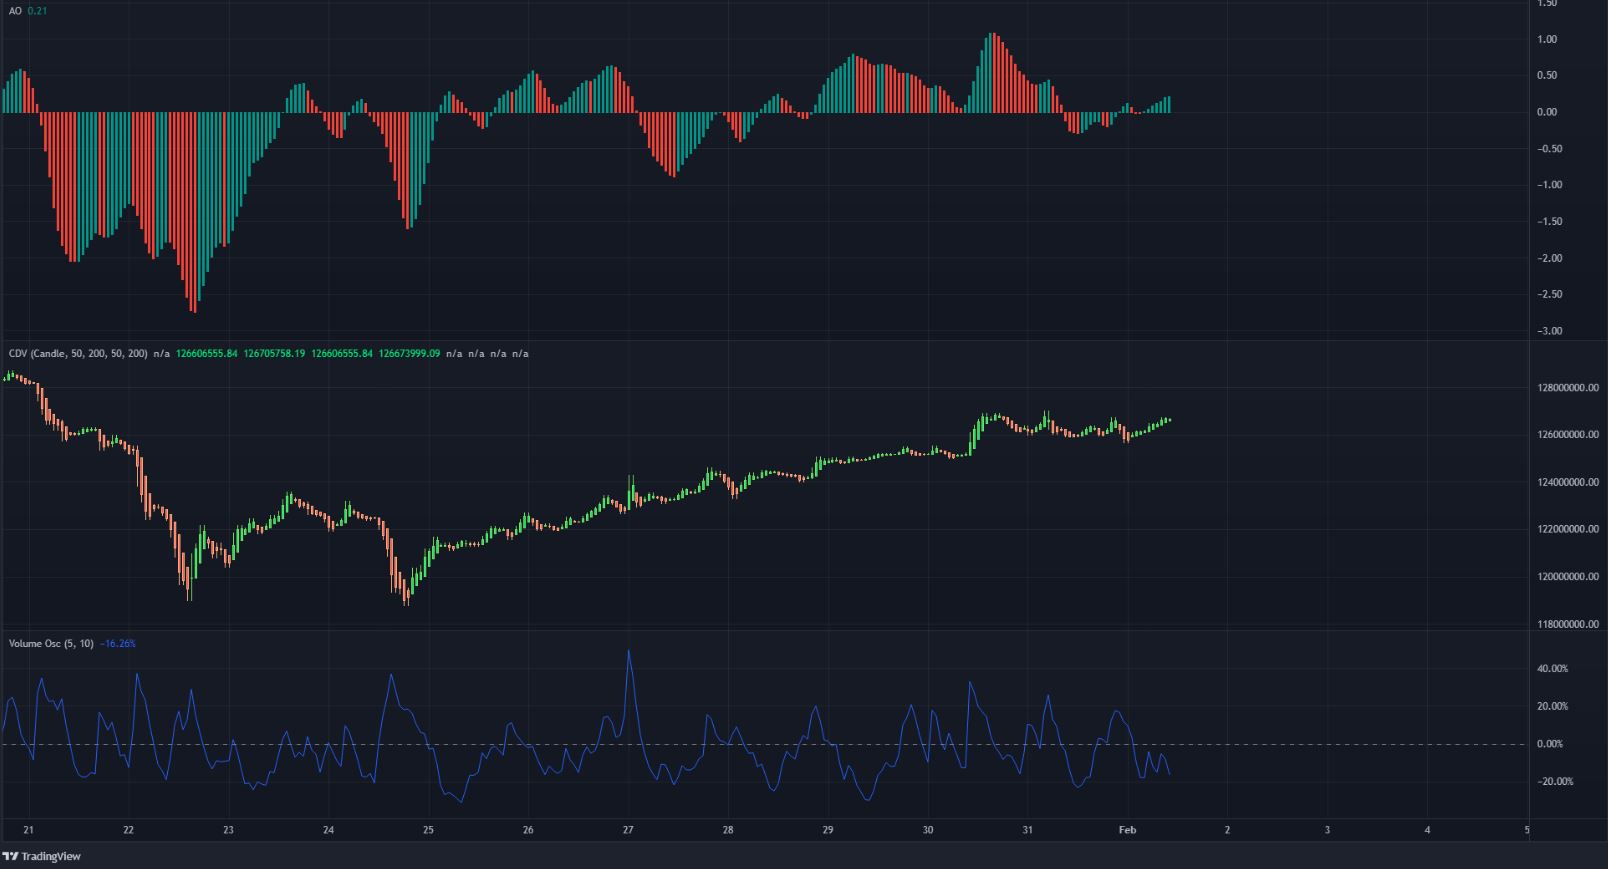
The Cumulative Delta Volume showed that the uptick in prices has indeed been backed by steady demand.
The Volume Oscillator highlighted how the recent tests of the $18 area were on high volume, and at the time of writing, the oscillator was below 0%.
Conclusion
The short-term momentum was bullish and demand was present. Chainlink’s direction over the next few days will depend on Bitcoin. But on its own, Chainlink showed it is ready for some gains in the near term.
However, a break above the $19.38 area would be needed to suggest that buyers had regained some control after the relentless selling over the past month.


