Terra, Dogecoin, SAND Price Analysis: 01 February

With the crypto market entering into a green zone over the last day, DOGE bulls endeavored to jump above its EMA ribbons after a brief consolidation phase. Also, LUNA’s 4-hour RSI found a close above the half-line.
After staggering gains over the past week, SAND formed a reversal pattern. Any close below its 54-mark (RSI) could pave a way for a potential breakdown.
Terra (LUNA)
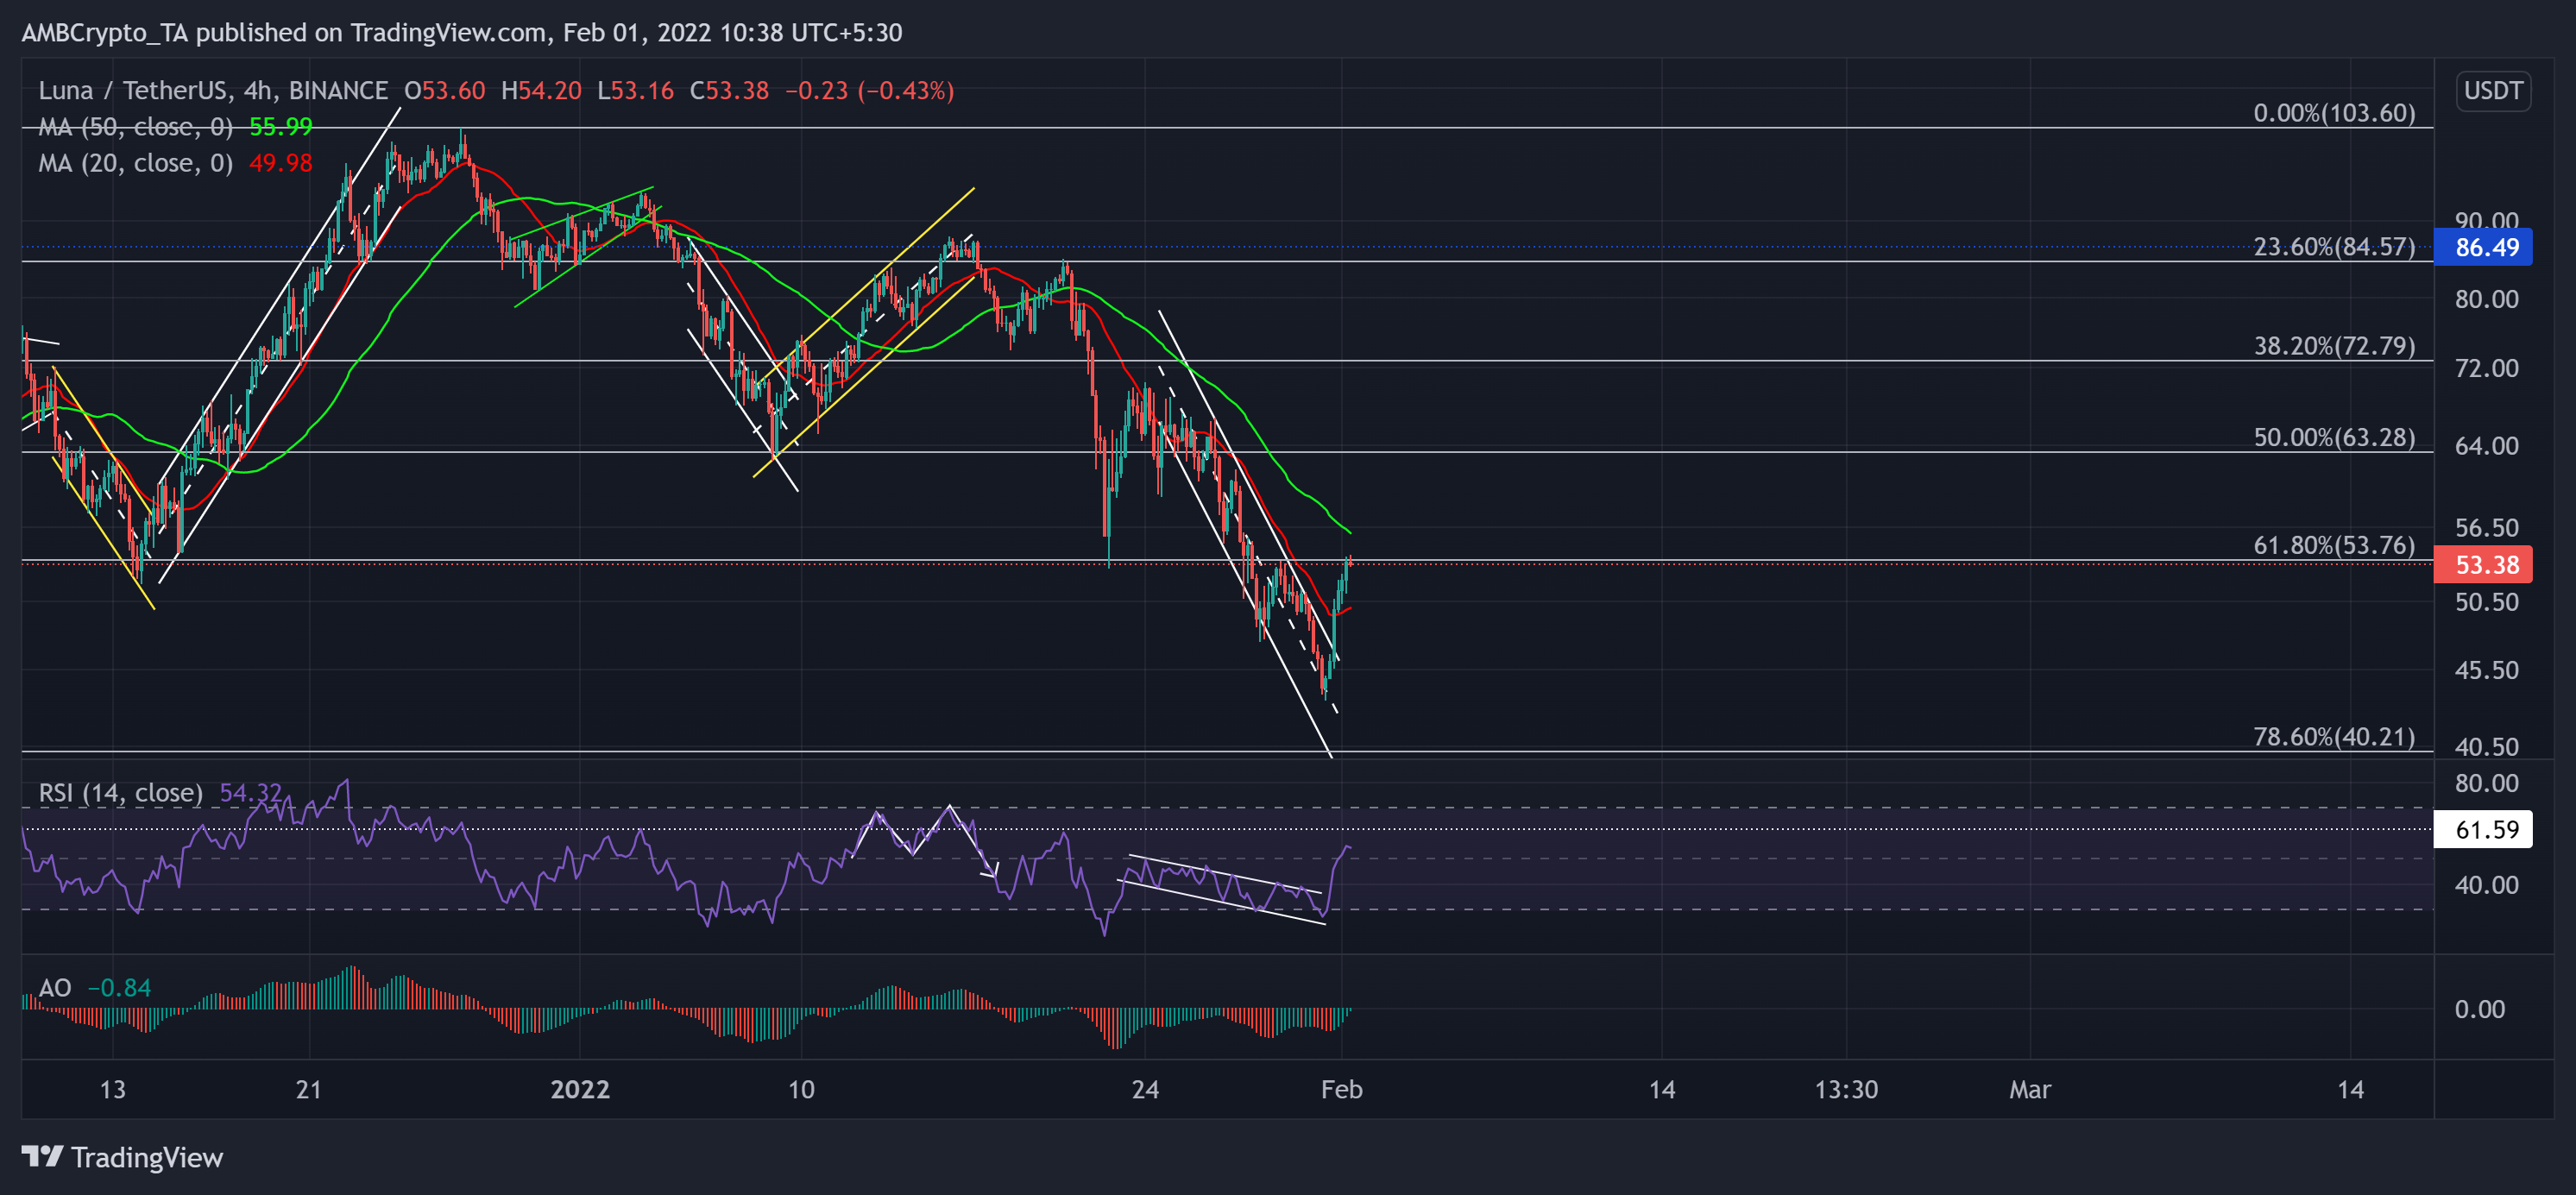
The $86.49-level resistance stood solid as the alt saw an up-channel (yellow) breakdown. Post that, LUNA saw a 50.11% fall (from 17 January) toward its two-month low on 31 January after losing the golden Fibonacci level.
The alt noted a 21.5% gain in the last 24 hours after breaking out of the down-channel (white). Now, the testing point for the bulls stood at the $53-level just below its 50 SMA (green). Any reversals would find support near the 20 SMA (red).
At press time, LUNA traded at $53.38. The RSI saw a 27 point revival after it saw a down-channel breakout. Thus, it reclaimed the half-line support and revealed a slight bullish edge. Also, the AO marked higher peaks while approaching the equilibrium. This reading entailed a decreasing selling influence.
Dogecoin (DOGE)
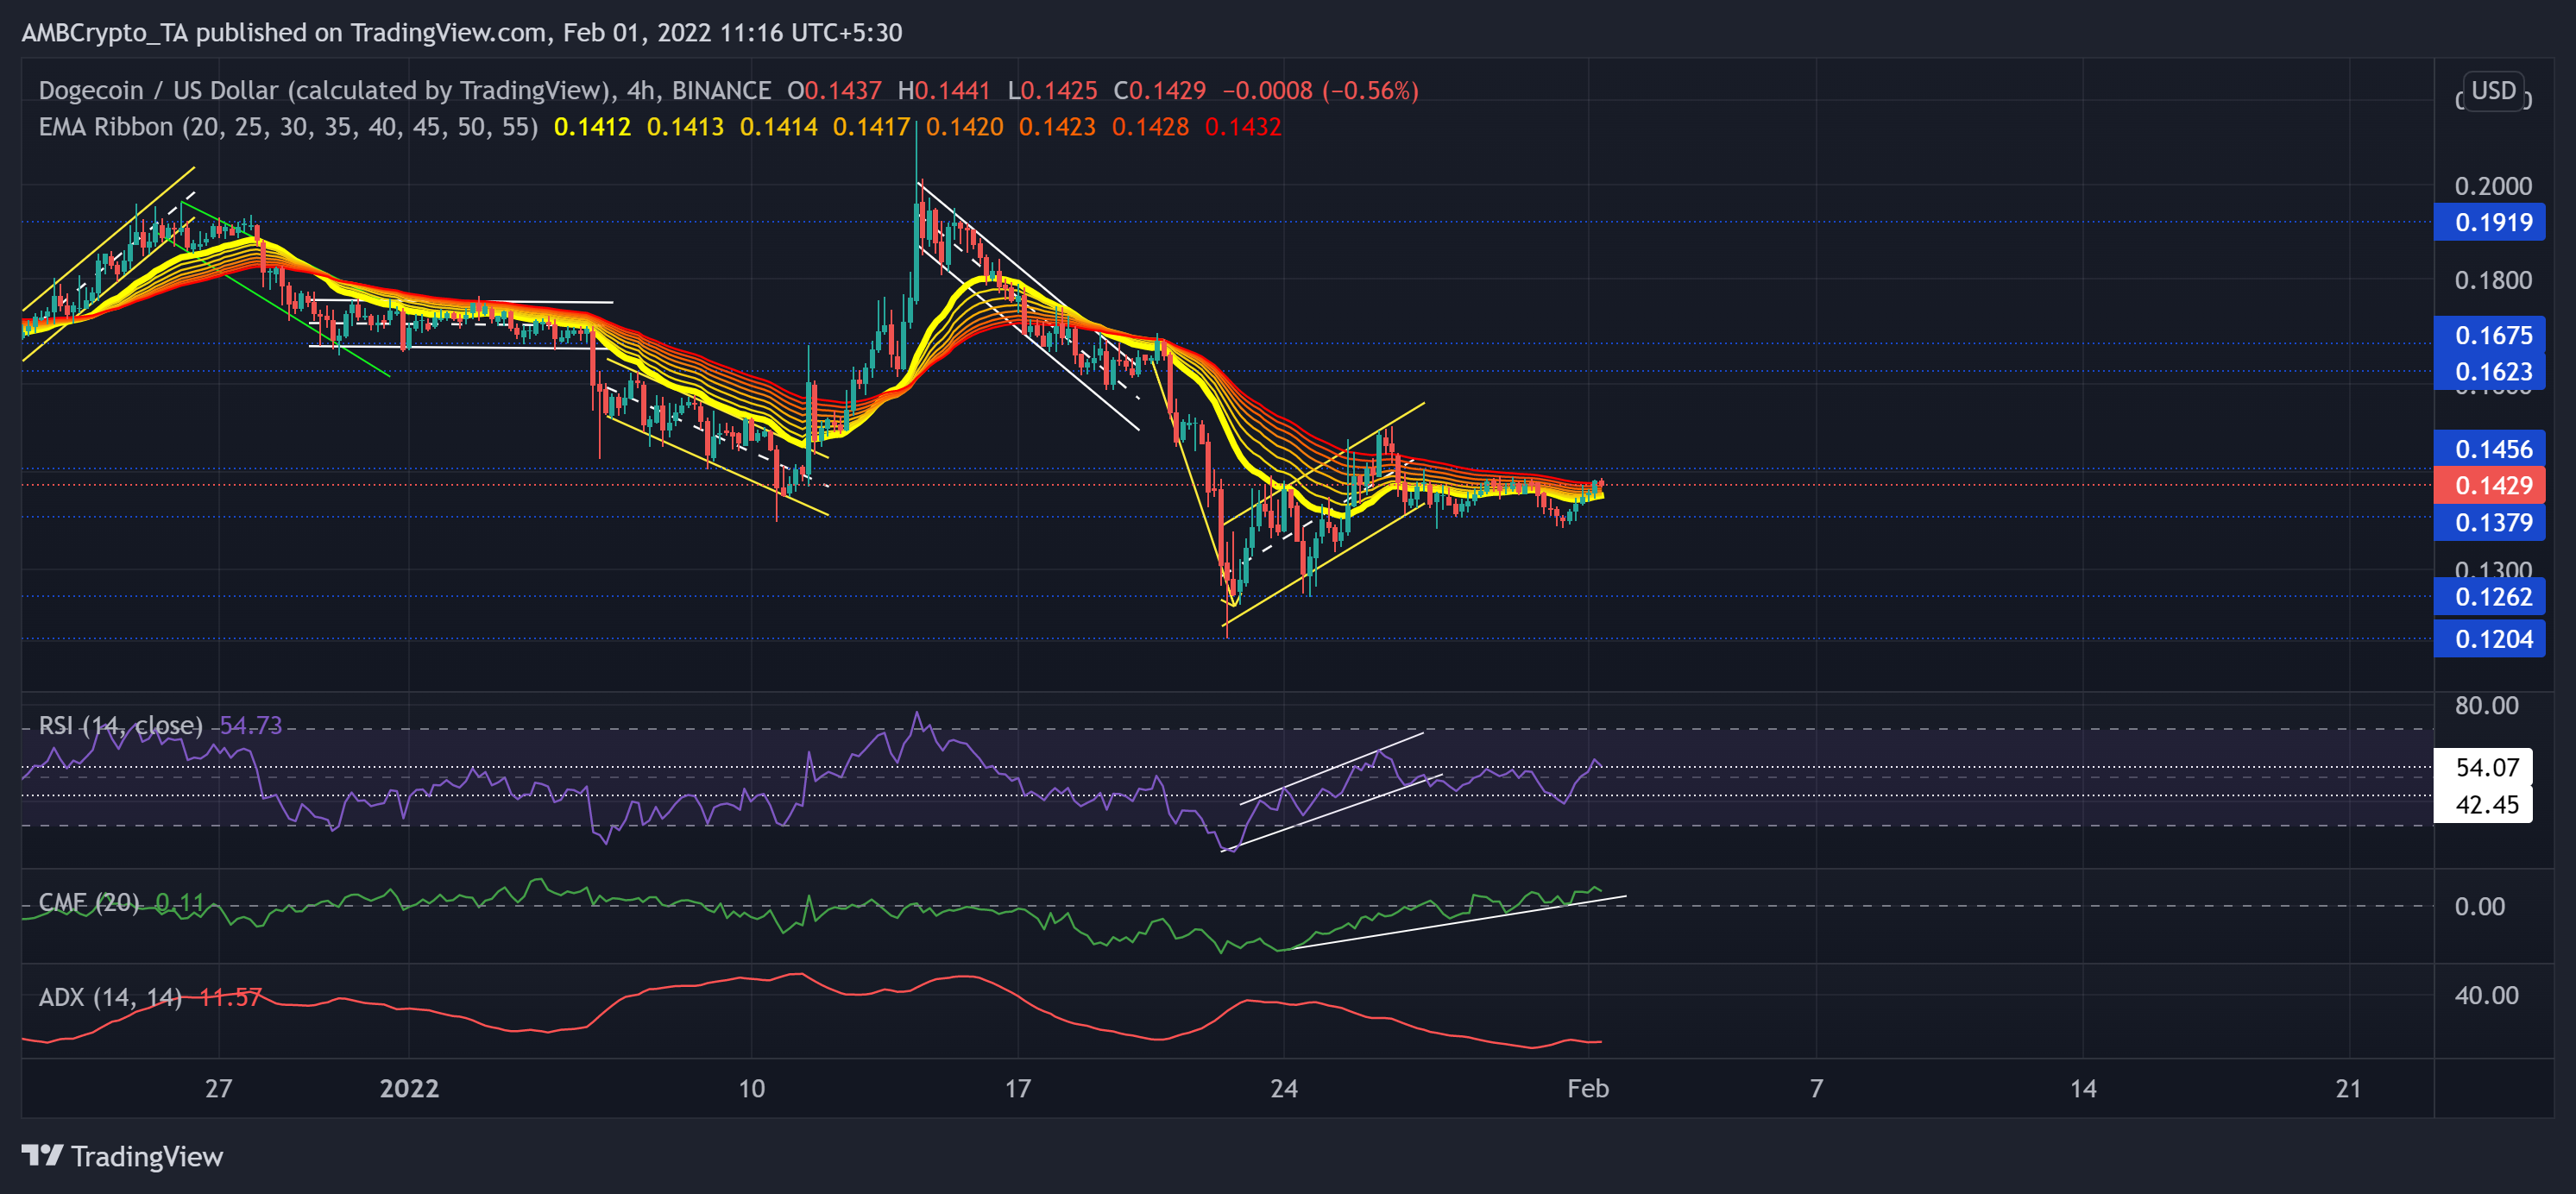
The altcoin saw a 44.03% retracement (from 14 January) and hit its nine-month low on 22 January. Since then, the recovery phase marked a bearish flag (yellow, bearish pattern) on its 4-hour chart. Since breaking out of it, DOGE consolidated between $0.1456 and $0.1379-mark.
During this phase, the gap between the EMA ribbons seemingly decreased. This movement hinted at a gradual increase in buying momentum. The immediate hurdle for the bulls continued to stand at the 55 EMA.
At press time, DOGE was trading at $0.1429. After the most recent revival, the RSI was finally able to sustain itself above the half-line over the past day. Also, the northbound CMF crossed the zero line and revealed a bullish bias. However, the ADX depicted a weak directional trend for DOGE.
The Sandbox (SAND)
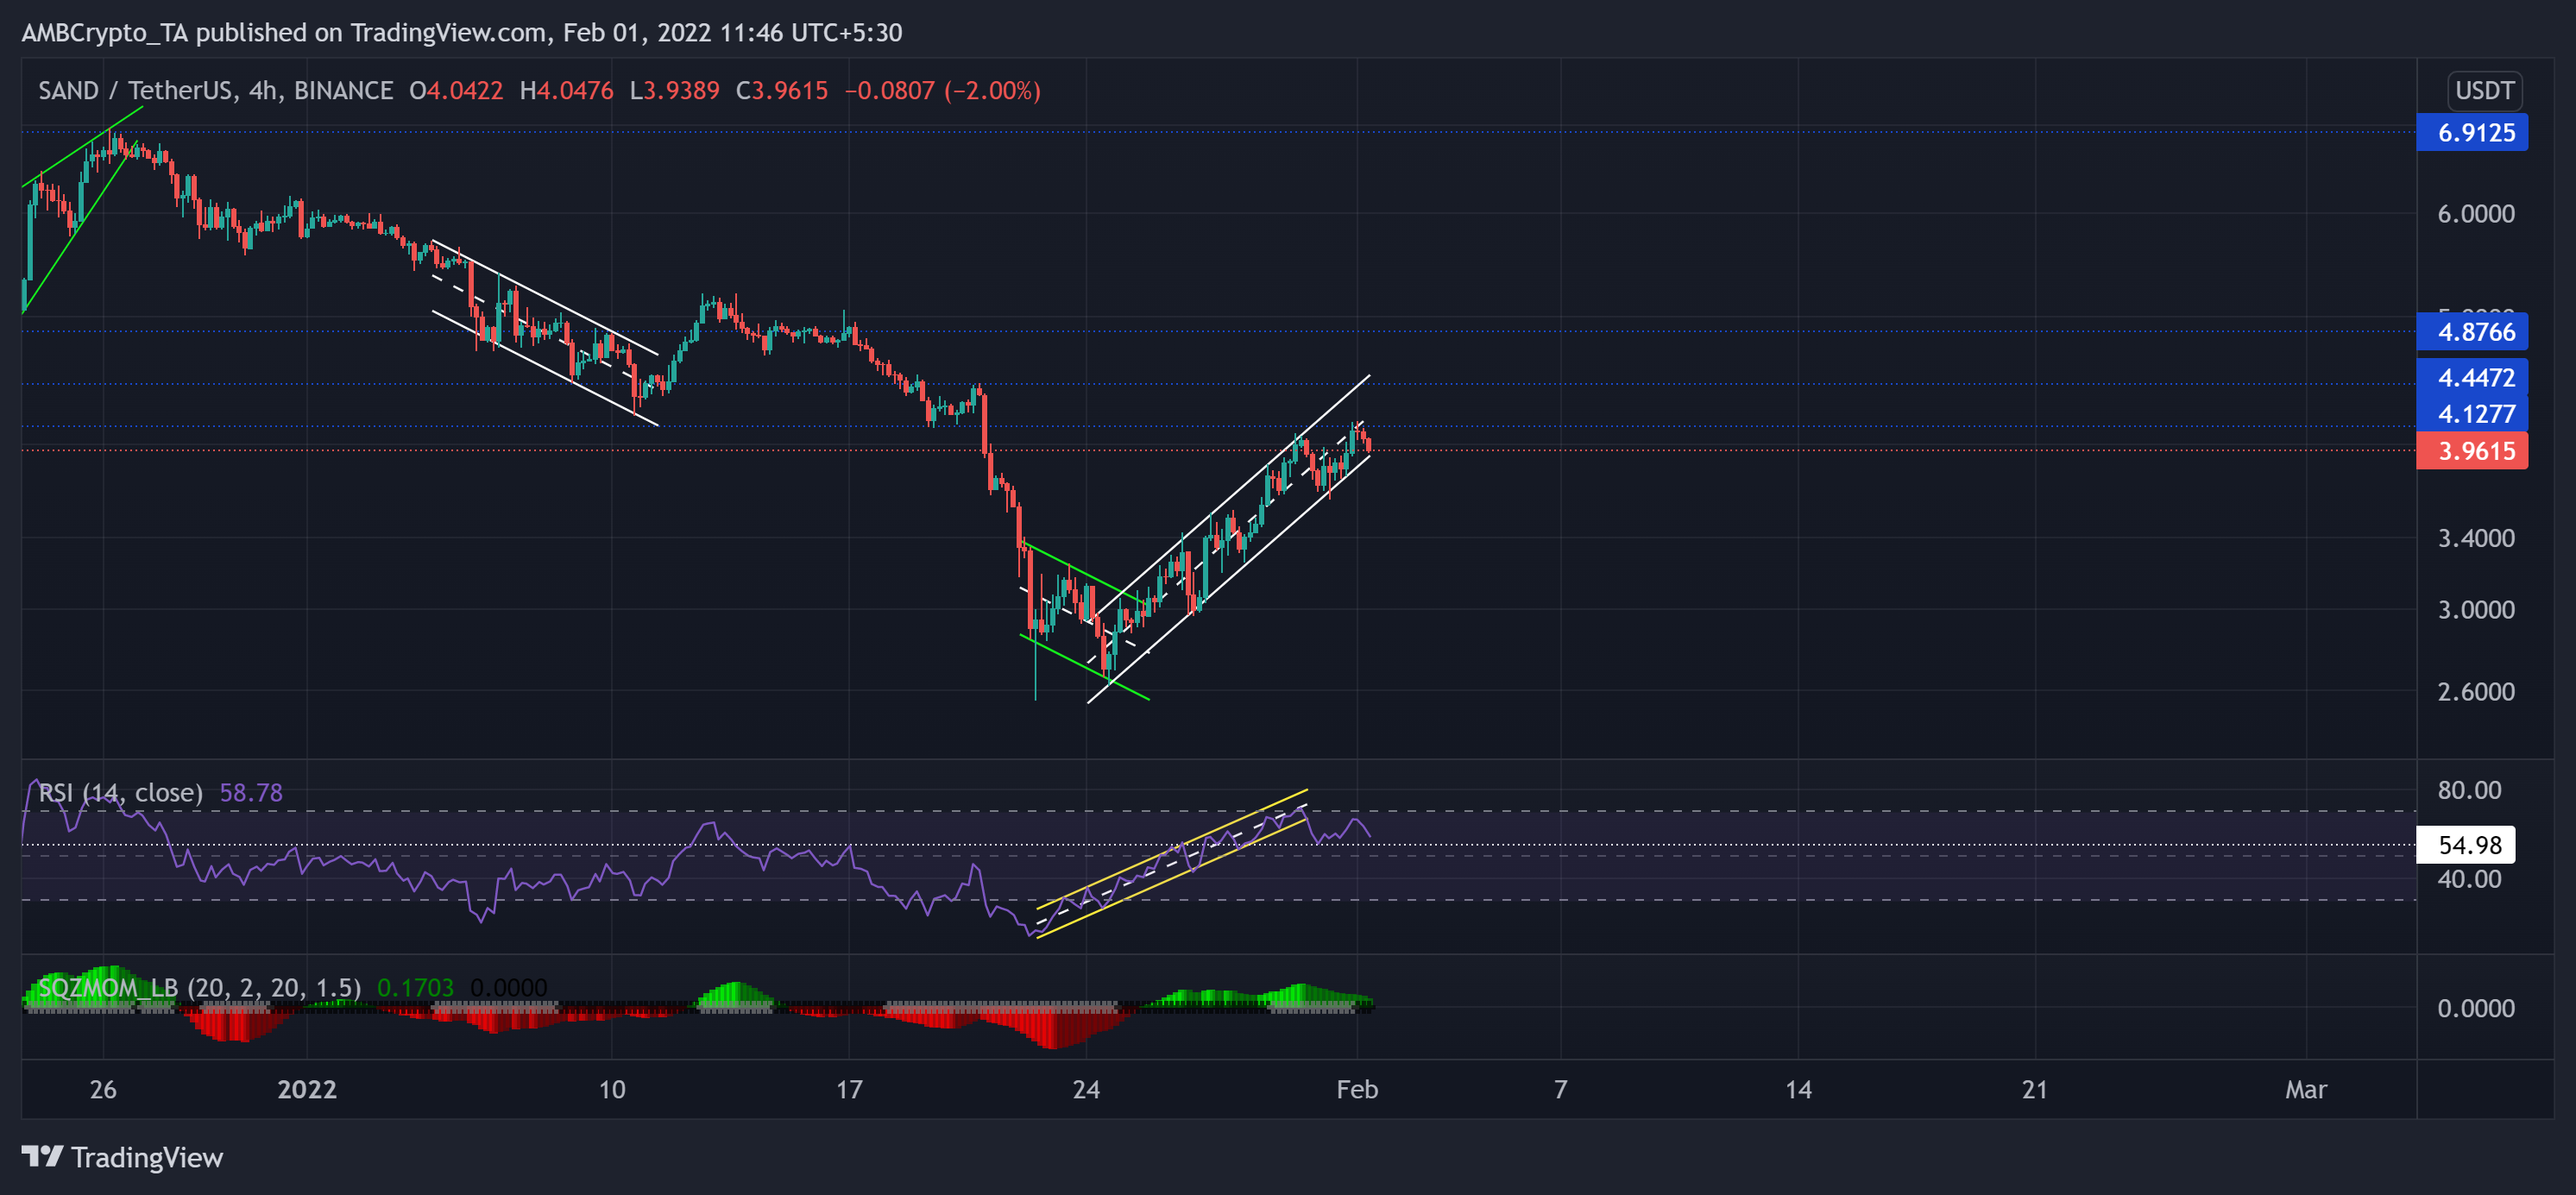
The recent up-channel rally could not breach the $4.12-mark as the bears tried to stall the swift upturn. The alt saw a 63.41% retracement (from 26 December high) until it poked its two-month low on 22 January.
Since then, it saw an over 54.9% recovery from the 24 January low. The bears have been ensuring resistance at the half-line of the up-channel over the past two days. Any fall below the lower trendline of the up-channel would propel a further breakdown.
At press time, SAND traded at $3.9615. The RSI steeply surged in an up-channel (yellow). After the breakdown, it rested at the 54-mark and tried to retest it at the time of writing. Now, the Squeeze Momentum Indicator revealed black dots, pointing at a low volatility phase in the near term.