Can Cosmos retain its week-long bullish strength in the short-term

In any market condition, there are always market leaders and laggards. In the past two weeks, Bitcoin has been ranging between $45.8k and $51k for the most part. In this time, certain altcoins have shown bullish strength, especially in the second half of December. Cosmos has been one of the larger crypto-assets which has performed particularly well. It formed a bottom at $21 and has climbed strongly since, breaking past several levels of significant resistance.

The confluence between the two sets (white and yellow) of Fibonacci retracement levels showed an area where the price was likely to find significant support or resistance. Combined with a horizontal level, such as the $25.38 or the $22.07 level, some areas presented themselves as zones where market sentiment could swing in the opposite direction.
The price dropped as low as $20.18 in mid-December when Bitcoin was also at its short-term range lows of $46k. Since then, Bitcoin surged to the highs of the range at $51k and retraced most of the move, while Cosmos still climbed steadily.
This was a sign of demand and strength behind ATOM over the past two weeks. Trading volume has been rising alongside the price, and ATOM recently climbed past the $32.4-$32.7 retracement level confluence too.
A pullback at $35.33 could occur as it has been a significant level in the past.
Rationale
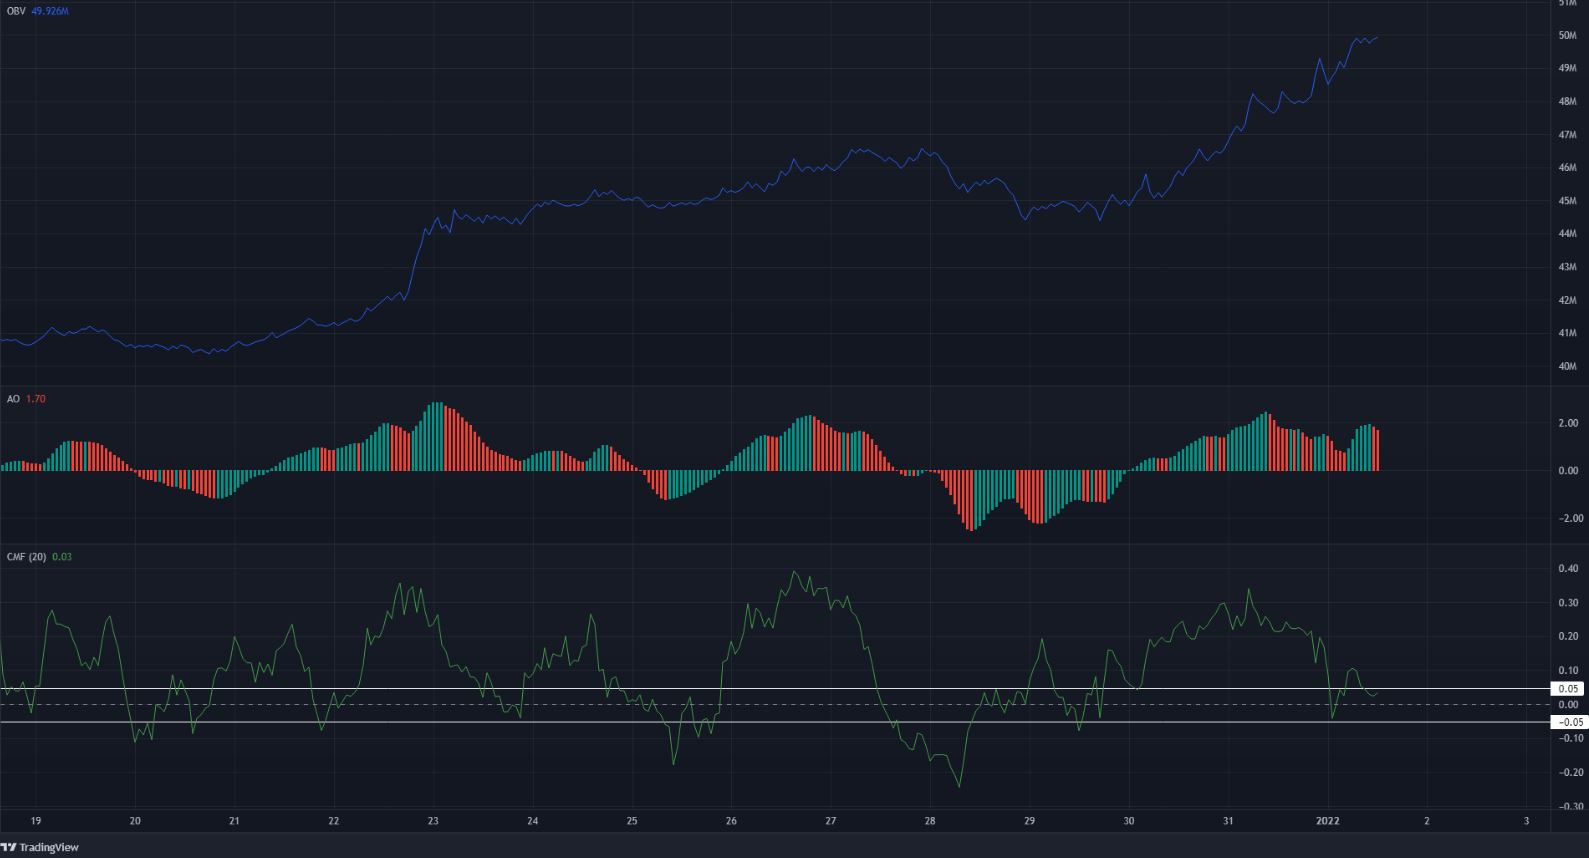
The OBV kept making higher highs, showing that market participants were eager to enter ATOM’s market, especially over the past week. The Awesome Oscillator (AO) was also comfortably above the zero line, showing bullish momentum.
However, the price made a higher high while the AO did not, indicating a possible minor dip/pullback in store for ATOM.
In a similar vein, the CMF had also been well above +0.05 over the past few days but dropped back toward zero.
Conclusion
The indicators showed that, in the short term, a pullback might occur. The price chart showed that the $32.44 level would likely serve as support, with demand expected to step in at the $31.2-$32.4 area if ATOM does see a pullback in the next few days. Such a pullback could be healthy and allow bulls to gather steam for another push toward $39-$40. Longer timeframes for ATOM did not show bullish strength falter yet.