Can Ethereum breach the crucial $2800 resistance and sustain a rally

Disclaimer: The findings of the following analysis are the sole opinions of the writer and should not be considered investment advice
Ethereum had been consolidating beneath the $2600 level in the past week, and three days ago the price broke above this level to test the next resistance zone at $2800. It has been rejected, at the time of writing, but likely not for long. Away from the price charts, it was noted that Ethereum rollups could see slow adoption rates and unsatisfactory user experience. Alongside the decline in prices, in the past three months, the daily number of transactions on the network has also seen a slight drop from around 1.22 million to 1.15 million.
ETH- 1H

The longer-term trend for Ethereum has been bearish. However, since late February, the price has formed a series of higher lows and also a series of lower highs since mid-November. This was a symmetrical triangle pattern (yellow) that price has been trading within in recent weeks.
Between these two trendlines and the higher lows-lower highs combination, ETH has seen some compression in recent weeks. This indicated that some volatility could be expected before a breakout in one direction.
In the near term, ETH could find support at $2760 and $2680. A move outside of the symmetrical pattern could set the trend for the next few weeks.
Rationale
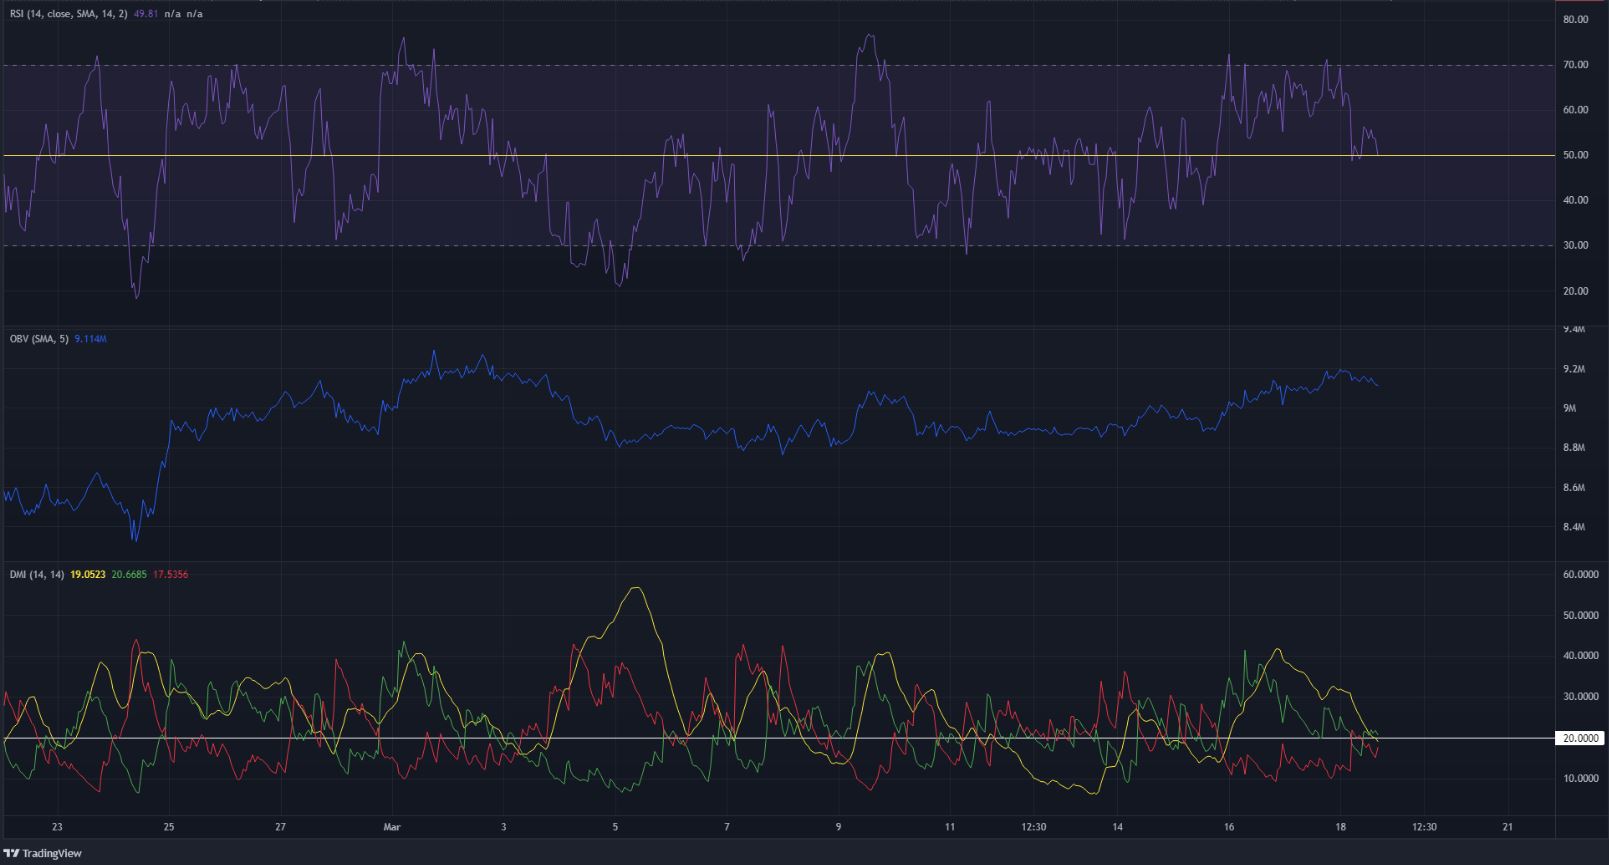
In which direction would such a breakout go? The RSI was back at neutral 50 after the rejection at $2830. This was the hourly chart- hence, it was near-term. The surge from $2520 to $2800 in the span of two-and-a-half days means that, overall, bulls have shown strength in the market. The OBV also rose in response to the buying volume.
The DMI shows a strong uptrend in recent days but, at press time, the ADX (yellow) and the +DI (green) were both on the verge of dropping below 20, to show the absence of a strong trend on the hourly chart.
Conclusion
It was hard to be certain of a direction for the next move. The series of higher lows suggests buyers are gaining strength, and a retest of $2760 or $2680 could offer a buying opportunity. To the upside, the $3200 represents attractive liquidity that ETH might be attracted to. The longer-term trend remains bearish, so rejection and a drop from $3200 can materialize.