Can Polkadot’s development activity act as a lifeboat to a drowning DOT

Ever since Polkadot [DOT] recorded an extremely high development activity, the blockchain has become a buzzing topic in the crypto industry. However, Polkadot didn’t intend to stop just there.
As per the crypto market intelligence platform, Santiment’s latest tweet, Polkadot, and Kusams’s shared GitHub repository continued to be the most active with regards to notable active development. Furthermore, almost 538 submissions were recorded per day.
🧑💻 #Polkadot's and #Kusama's shared #github repository continue to be the most active in regard to notable active development, with 538 submissions recorded per day. #Ethereum, #Cardano, and #Status currently round out the top five. https://t.co/fvVUKEYPgY pic.twitter.com/uGC5bmvmHX
— Santiment (@santimentfeed) October 12, 2022
Increasing development activity is always good news for a blockchain as it represents the behind-the-curtain efforts on improving the network.
Interestingly, in addition to the above-mentioned development, Polkadot introduced several integrations that helped add value to the network.
For instance, Kraken exchange announced the launch of new DOT collateral. With this development, investors will be able to use DOT to get exposure to over 75 perpetual futures contracts.
New collateral live:
Use DOT to get exposure to over 75 perpetual futures contracts now!
Get started today by transferring DOT from your Kraken spot wallet to your Kraken Futures wallet.
*Geo restrictions apply
➡️ https://t.co/gXlIibZ9Mk pic.twitter.com/LbypBwHpZh
— Kraken (@krakenfx) October 11, 2022
However, despite such positive news, DOT’s price chart remained gloomy as it failed to register any promising uptick. According to data from CoinMarketCap, DOT was down by over 3% in the last seven days and, at the time of writing, it was trading at $6.20.
Here’s AMBCrypto’s Price Prediction for Polkadot [DOT] for 2023-24
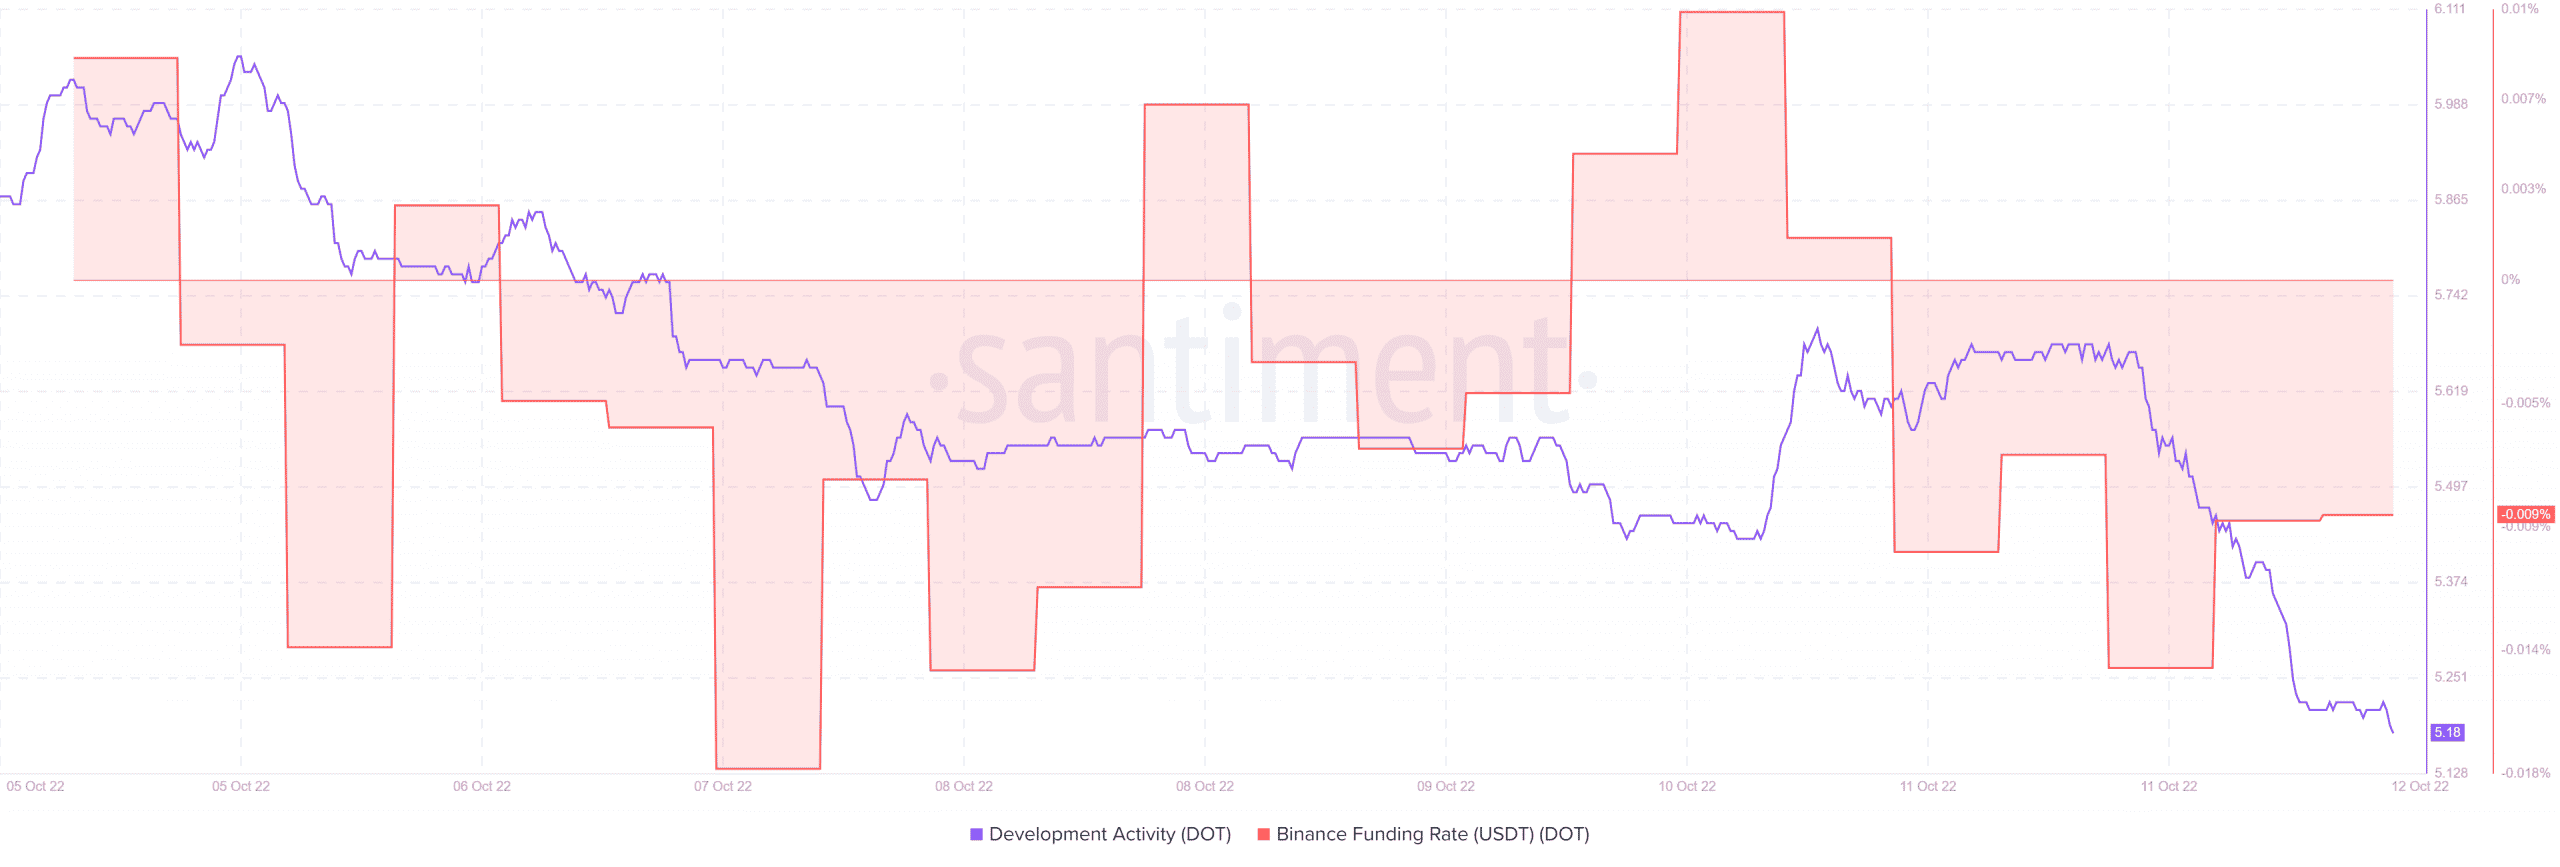
Despite such continued efforts, Polkadot registered a decline in its development activity last week. Moreover, though DOT’s Binance funding rate went up slightly, it was still below its 10 October level. This suggested a lower interest in the token from the derivatives market.
However, the good news was- while DOT’s price fell, its volume took the opposite path and increased during the last week.
The surge in volume decreases the chances of an unprecedented price plummet in the coming days. Moreover, DOT’s social dominance also spiked in the past seven days. Thus, suggesting the increased popularity of cryptocurrency.

Bears still winning?
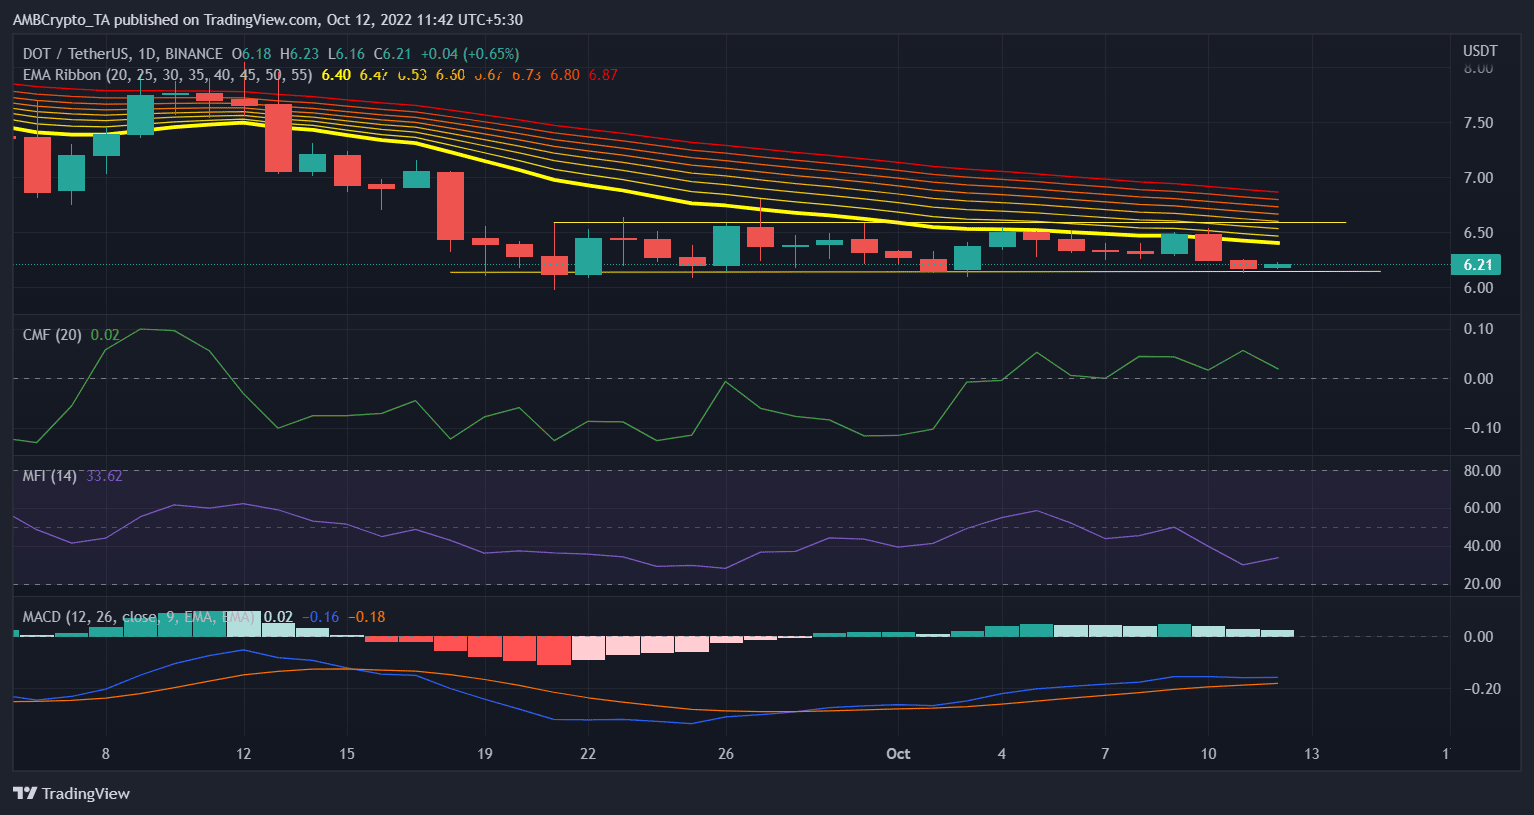
A look at DOT’s daily chart gave a bearish indication as most of the market indicators favored the sellers. The Exponential Moving Average (EMA) Ribbon revealed that the 55-day EMA was resting well above the 20-day EMA, indicating a massive bear advantage in the market.
Interestingly, the alt’s price had followed a sideways path for quite some time and showed support and resistance at the $6.15 and $6.5 marks, respectively. DOT’s Chaikin Money Flow (CMF) registered a downtick and was heading toward a neutral position.
Moreover, the Money Flow Index (MFI) was far away from the neutral line, further indicating the sellers’ upper hand.
However, the data of Moving Average Convergence Divergence (MACD) gave some relief as it suggested that bulls had a slight advantage over bears.