Can Solana scale $180? What SOL’s price indicators suggest
Despite SOL’s recent price troubles, its funding rate across cryptocurrency exchanges remains positive.
- SOL has witnessed a drop in buying momentum in the past few days.
- This signals the re-emergence of SOL bears.
Solana [SOL] is poised to fall below its 20-day exponential moving average (EMA), signaling a decline in buying pressure.
This comes a week after the coin traded above the key moving average. SOL’s 20-day EMA represents its average price over the past 20 days.
When its price falls below this level, the coin trades at a level lower than its average price in the past 20 days. It signals a decline in buying pressure and a rally in coin sell-offs.
SOL sees rising bearish activity
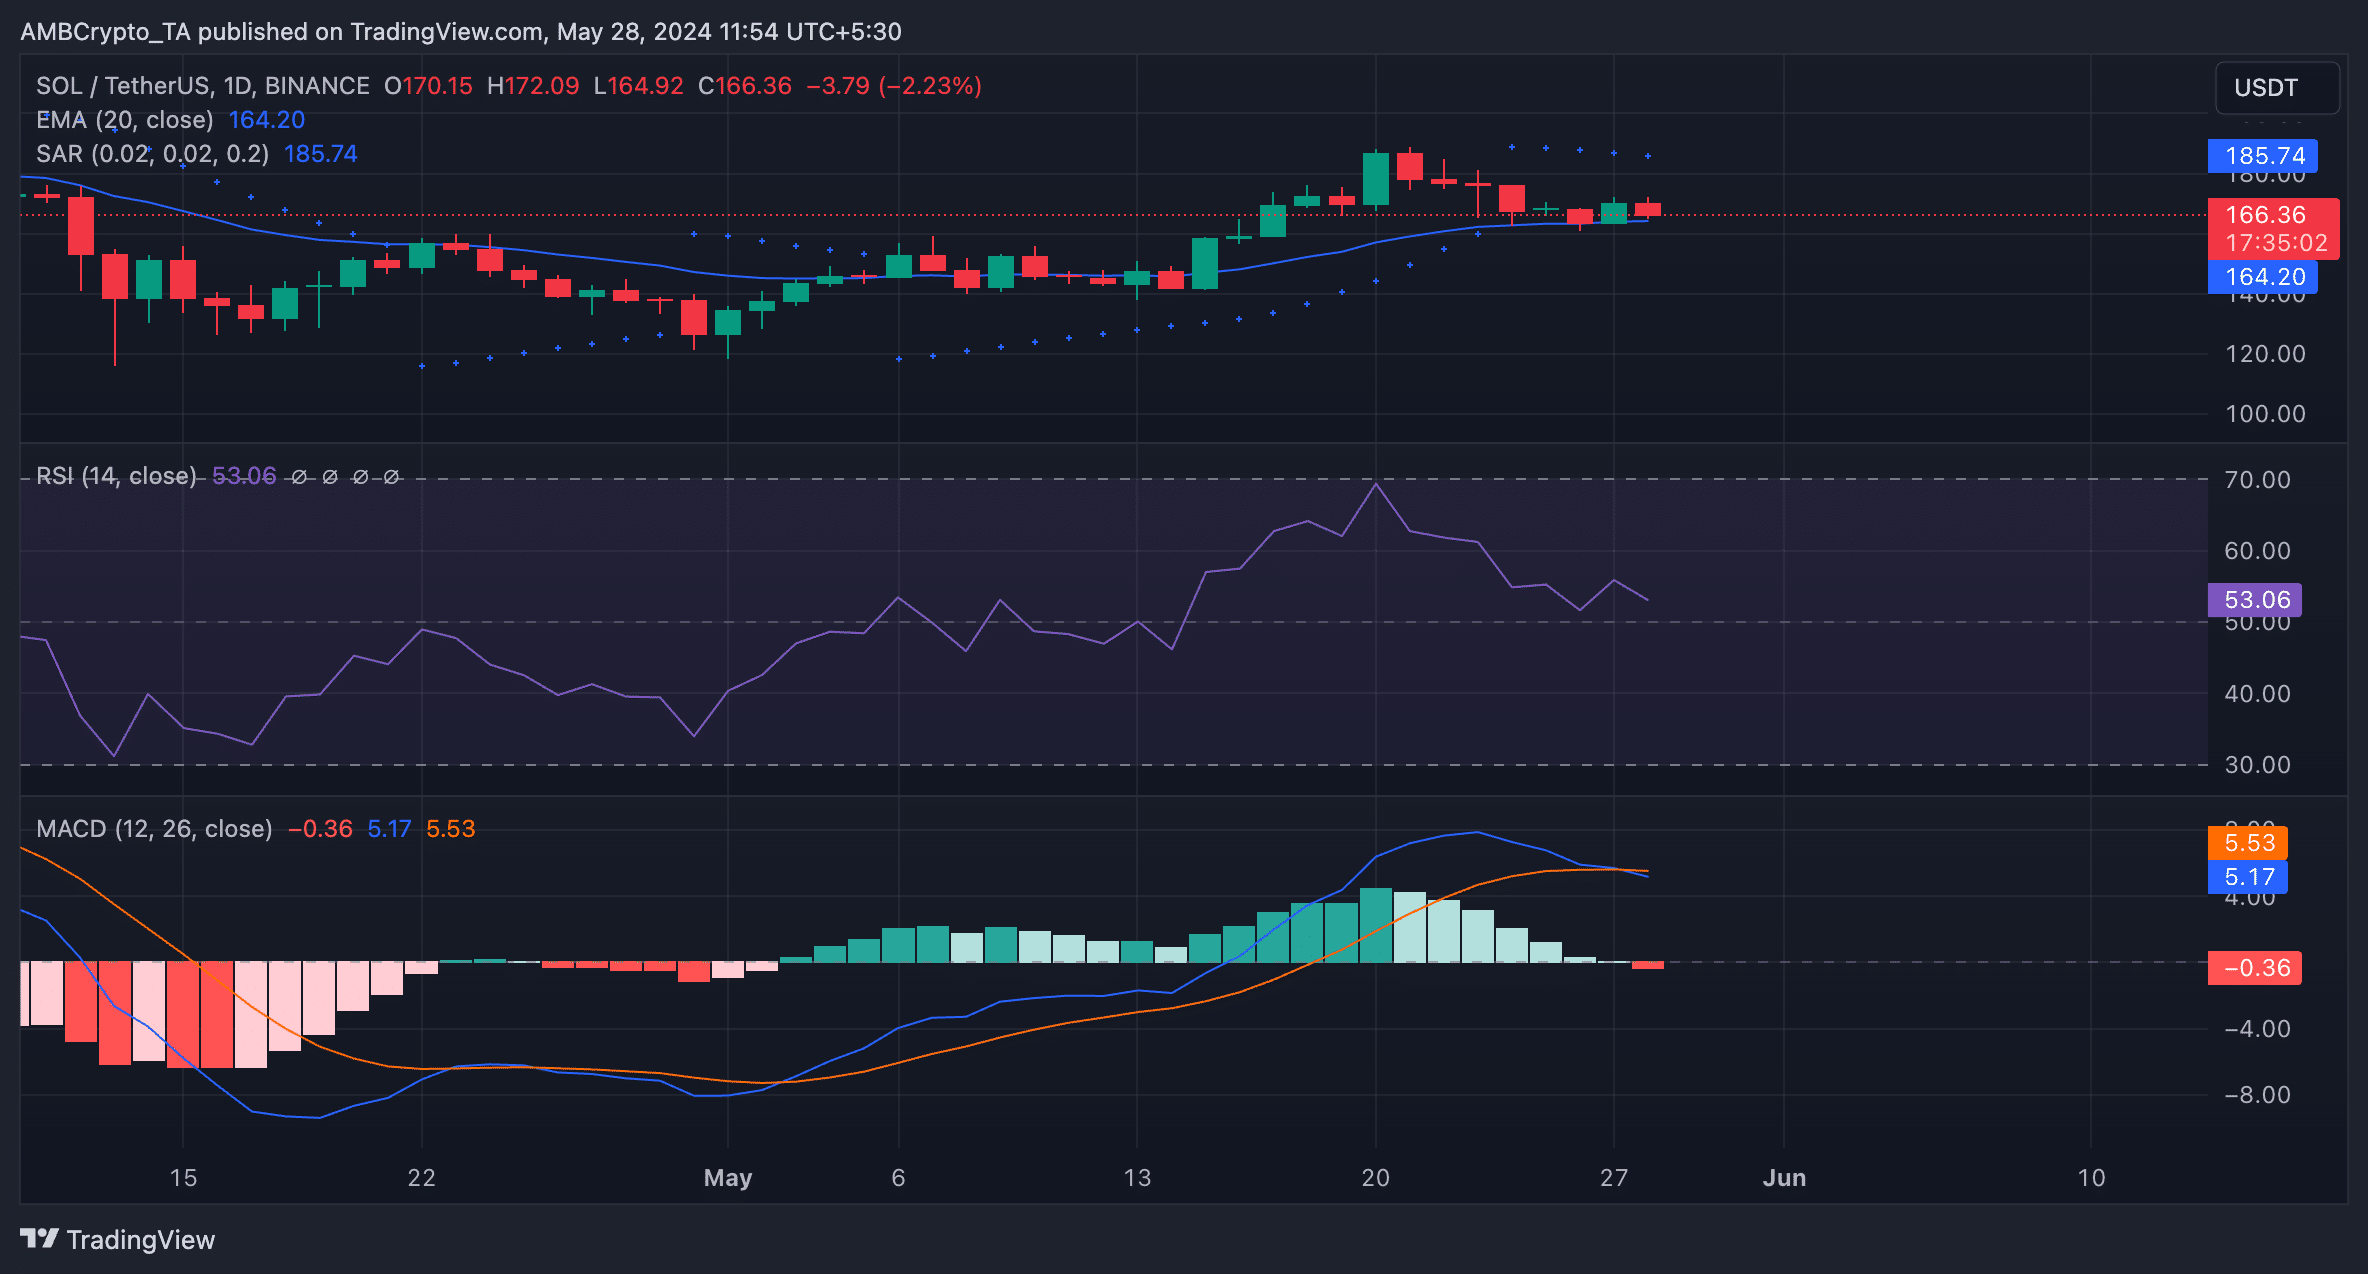
AMBCrypto’s assessment of SOL’s movements on a 1-day chart confirmed the steady decline in bullish activity in the coin’s market.
For example, readings from SOL’s Moving Average Convergence Divergence (MACD) indicator revealed a downward intersection of the MACD line (blue) with the signal line (orange) at press time.
When an asset’s MACD line crosses below the signal line, it is called a bearish crossover. It signals that the accent’s recent price rally might be losing momentum, and a potential price decline could occur.
Traders often interpret this crossover as a signal to sell or open short and exit long positions.
Further, the dots of SOL’s Parabolic SAR indicator were atop its price as of this writing. These dots have been positioned this way since 24 May, AMBCrypto found.
This indicator identifies potential trend direction and reversals. When its dotted lines are placed above an asset’s price, the market is said to be in a decline. It suggests that the asset’s price has been falling and may continue.
Also, the value of SOL’s Relative Strength Index (RSI) hinted at the declining demand for the altcoin. At 53.47, and in a downtrend at press time, the indicator suggested that selling pressure was beginning to surge.
Not the end of the road for Solana
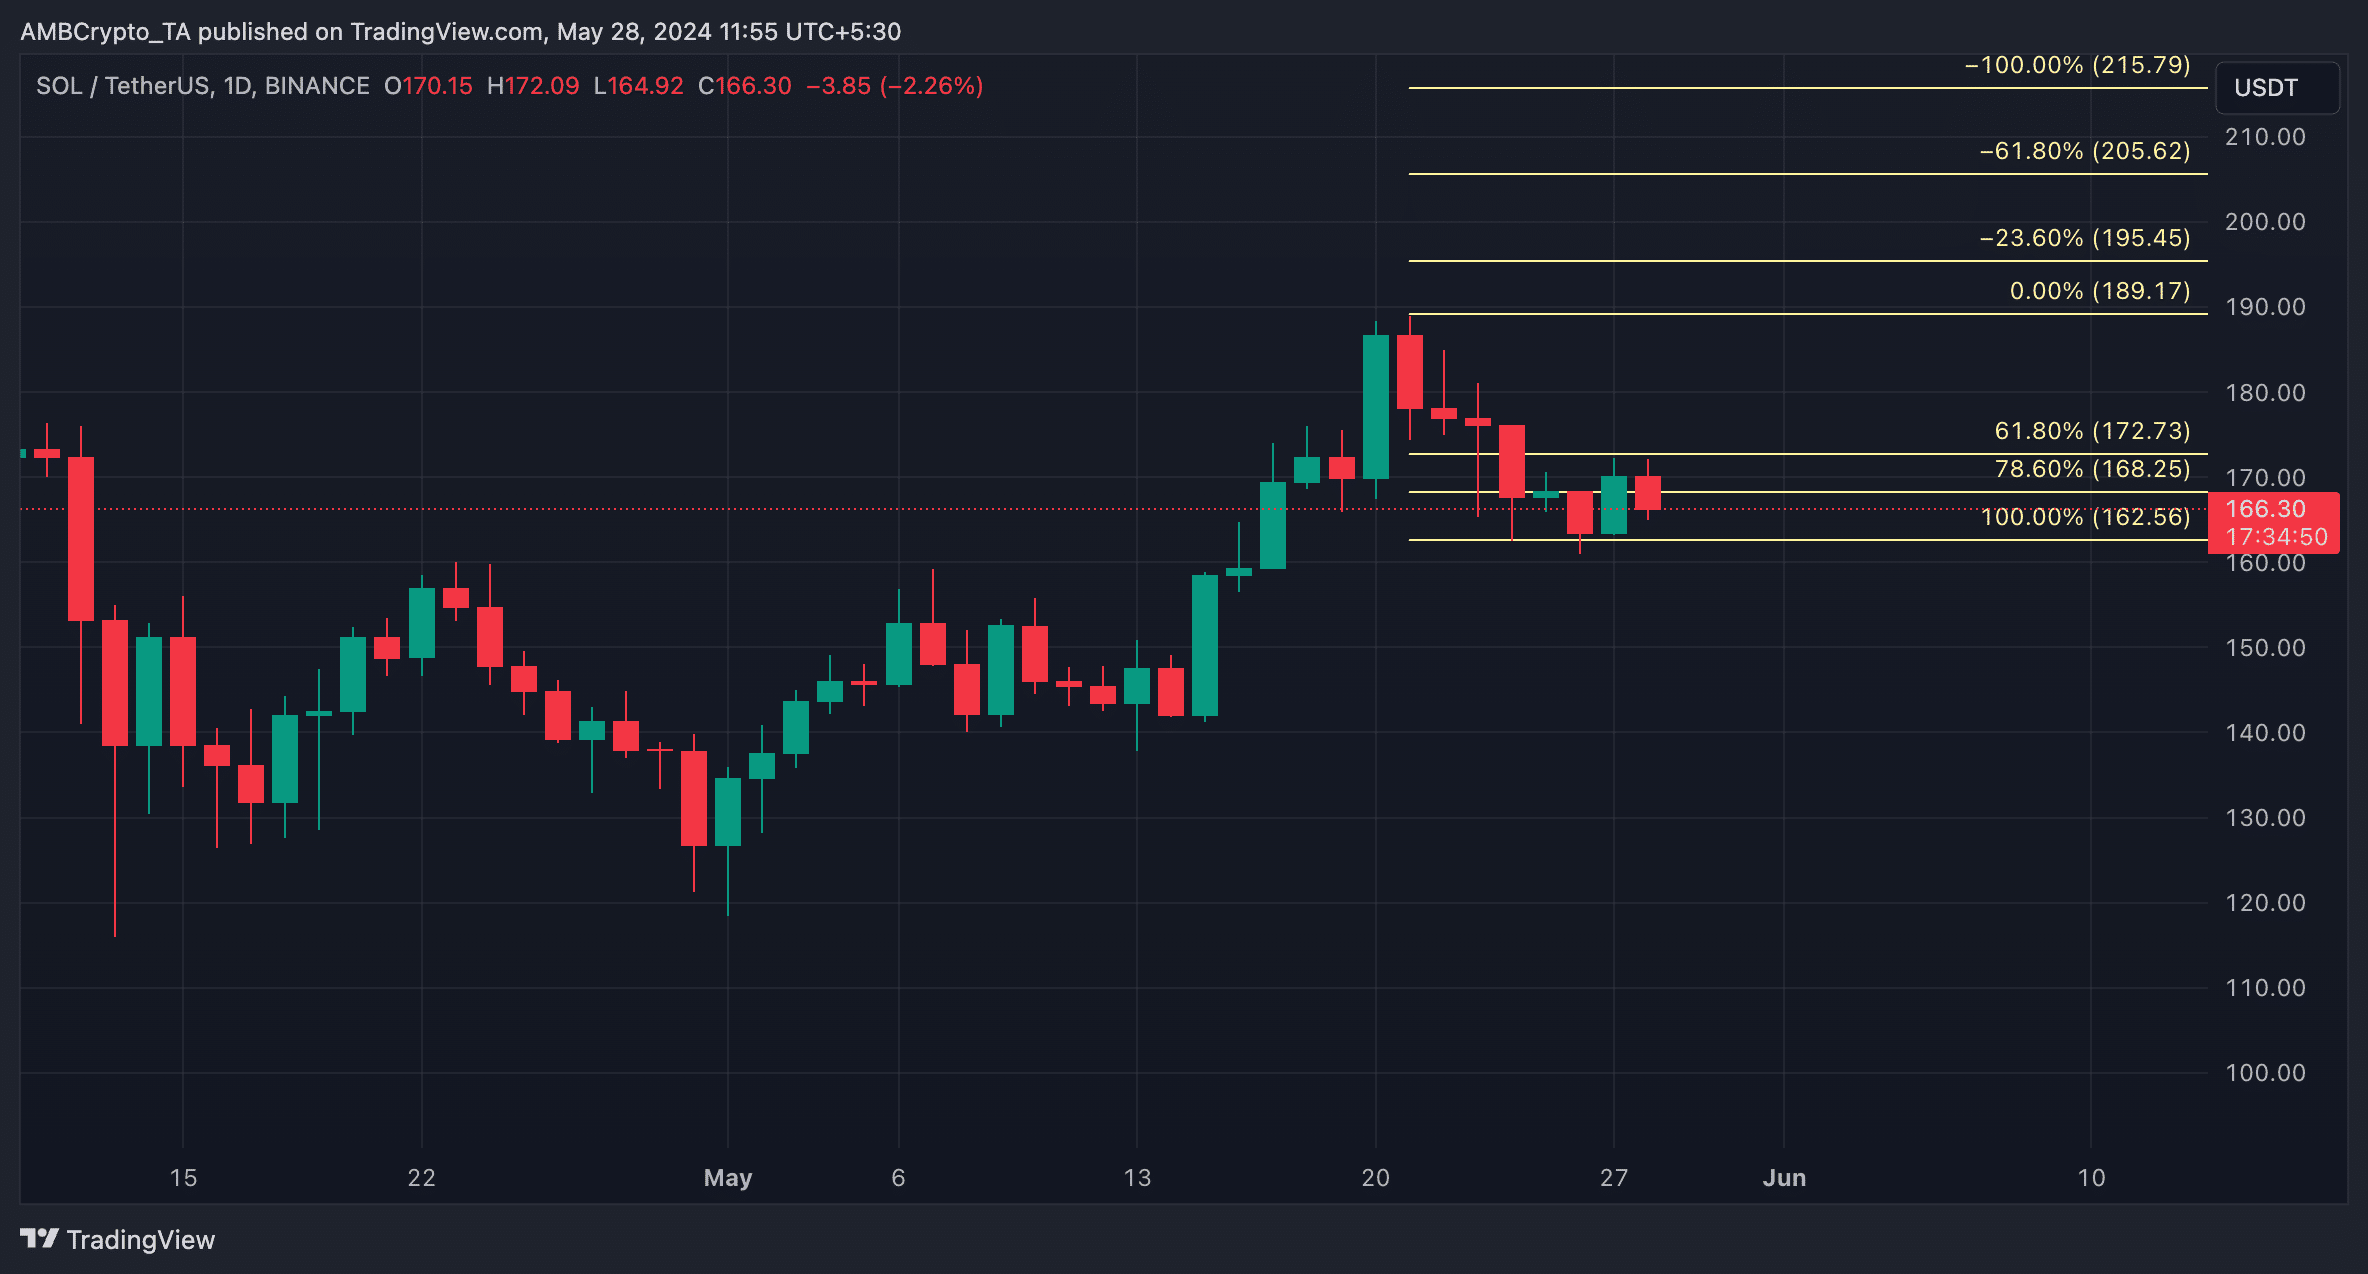
If SOL’s buying momentum plummets further, the coin’s price might fall toward $162.56.
However, if this bearish projection is invalidated and the bulls regain market control, the altcoin may rally to exchange hands above $170 at $172.73.
The possibility of this happening in the short term is likely as SOL’s funding rate in its futures market remains positive despite its recent headwinds.
Read Solana’s [SOL] Price Prediction 2024-25
Funding rates are used in perpetual futures contracts to ensure the contract price stays close to the spot price.
When an asset’s funding rate is positive, it suggests a strong demand for long positions. According to Coinglass’ data, SOL’s funding rate was 0.0147% at press time.


