Cardano, Algorand, Filecoin Price Analysis: 13 January

As market leaders paved the recovery path, Cardano crossed its 4-hour EMA ribbons while flipping the $1.2-mark as support. Also, Algorand and Filecoin managed to flip their near-term SMA’s from resistance to support while reclaiming crucial price levels.
However, it may be too harsh to assume a solid trend reversal until the bulls marked a sustained close above the long-term bearish trendlines. Further, they needed to step in with increased volumes to support a promising rally.
Cardano (ADA)
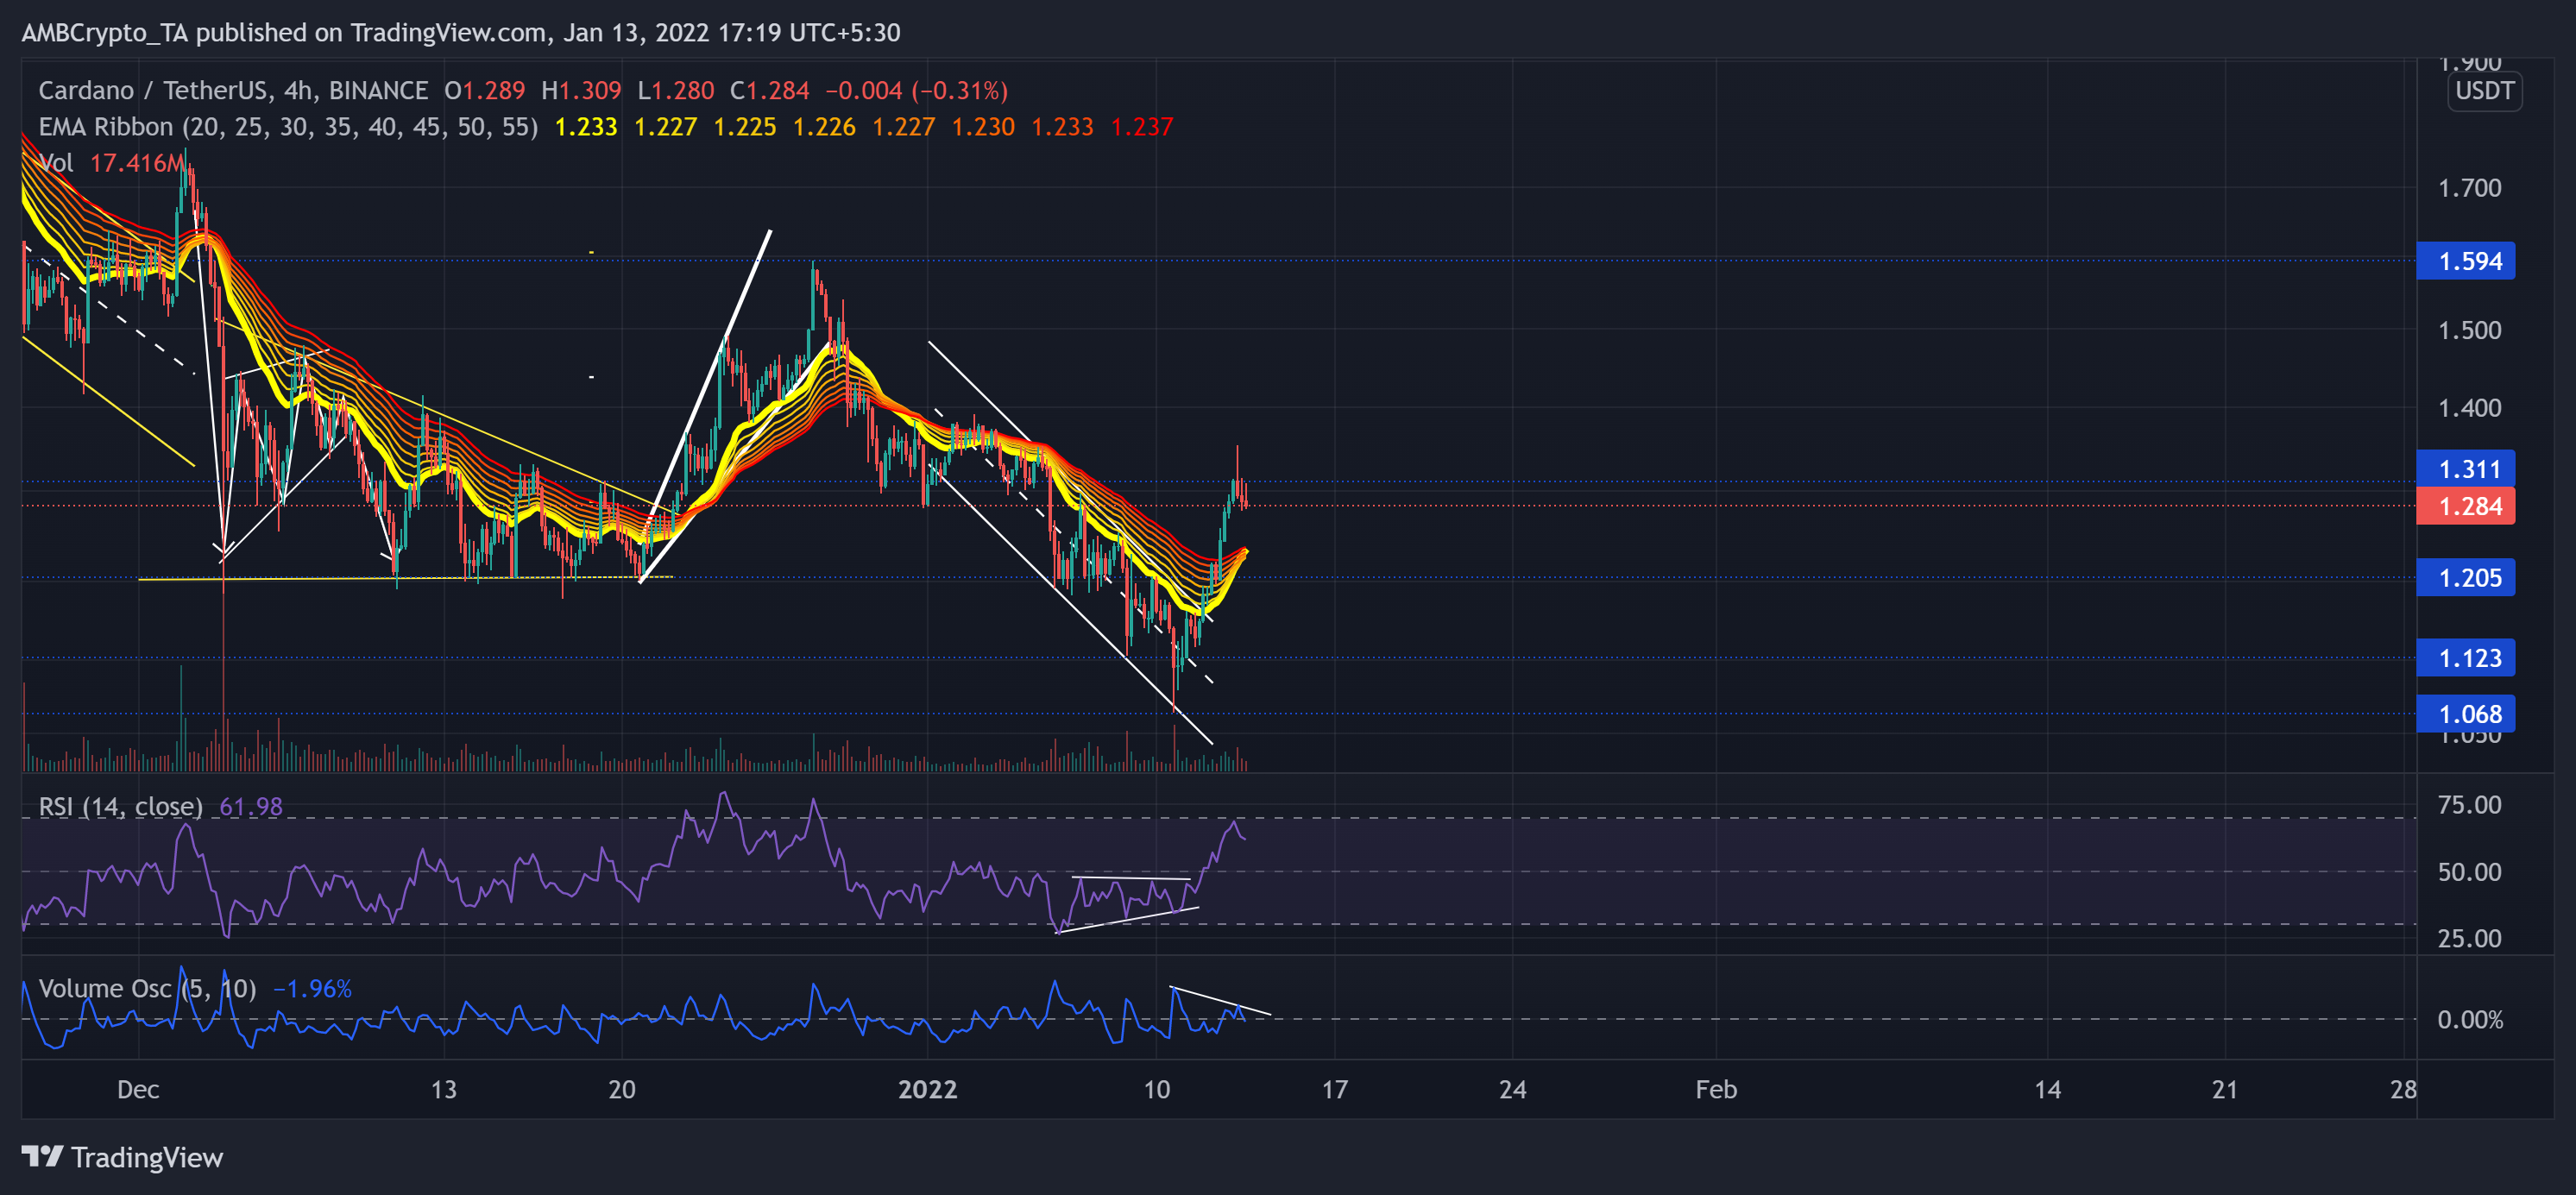
ADA’s broadening wedge (white) downturned from the $1.5-mark resistance. As a result, it saw a 32.84% down-channel retracement (from 27 December high) until it poked its six-month low on 10 January.
While the 20-EMA stood as a strong resistance throughout the downfall, the recent bull run found a convincing close above all the EMA ribbons. Now, as ADA tested the $1.3-resistance, the bulls reclaimed the vital $1.2-support.
At press time, ADA traded at $1.284. The RSI saw an expected upturn after forming an ascending triangle on the 4-hour timeframe. Now, it dipped from the overbought region and showed slowing signs. Besides, the Volume Oscillator struggled to flash higher volumes, depicting a weak broader trend.
Algorand (ALGO)
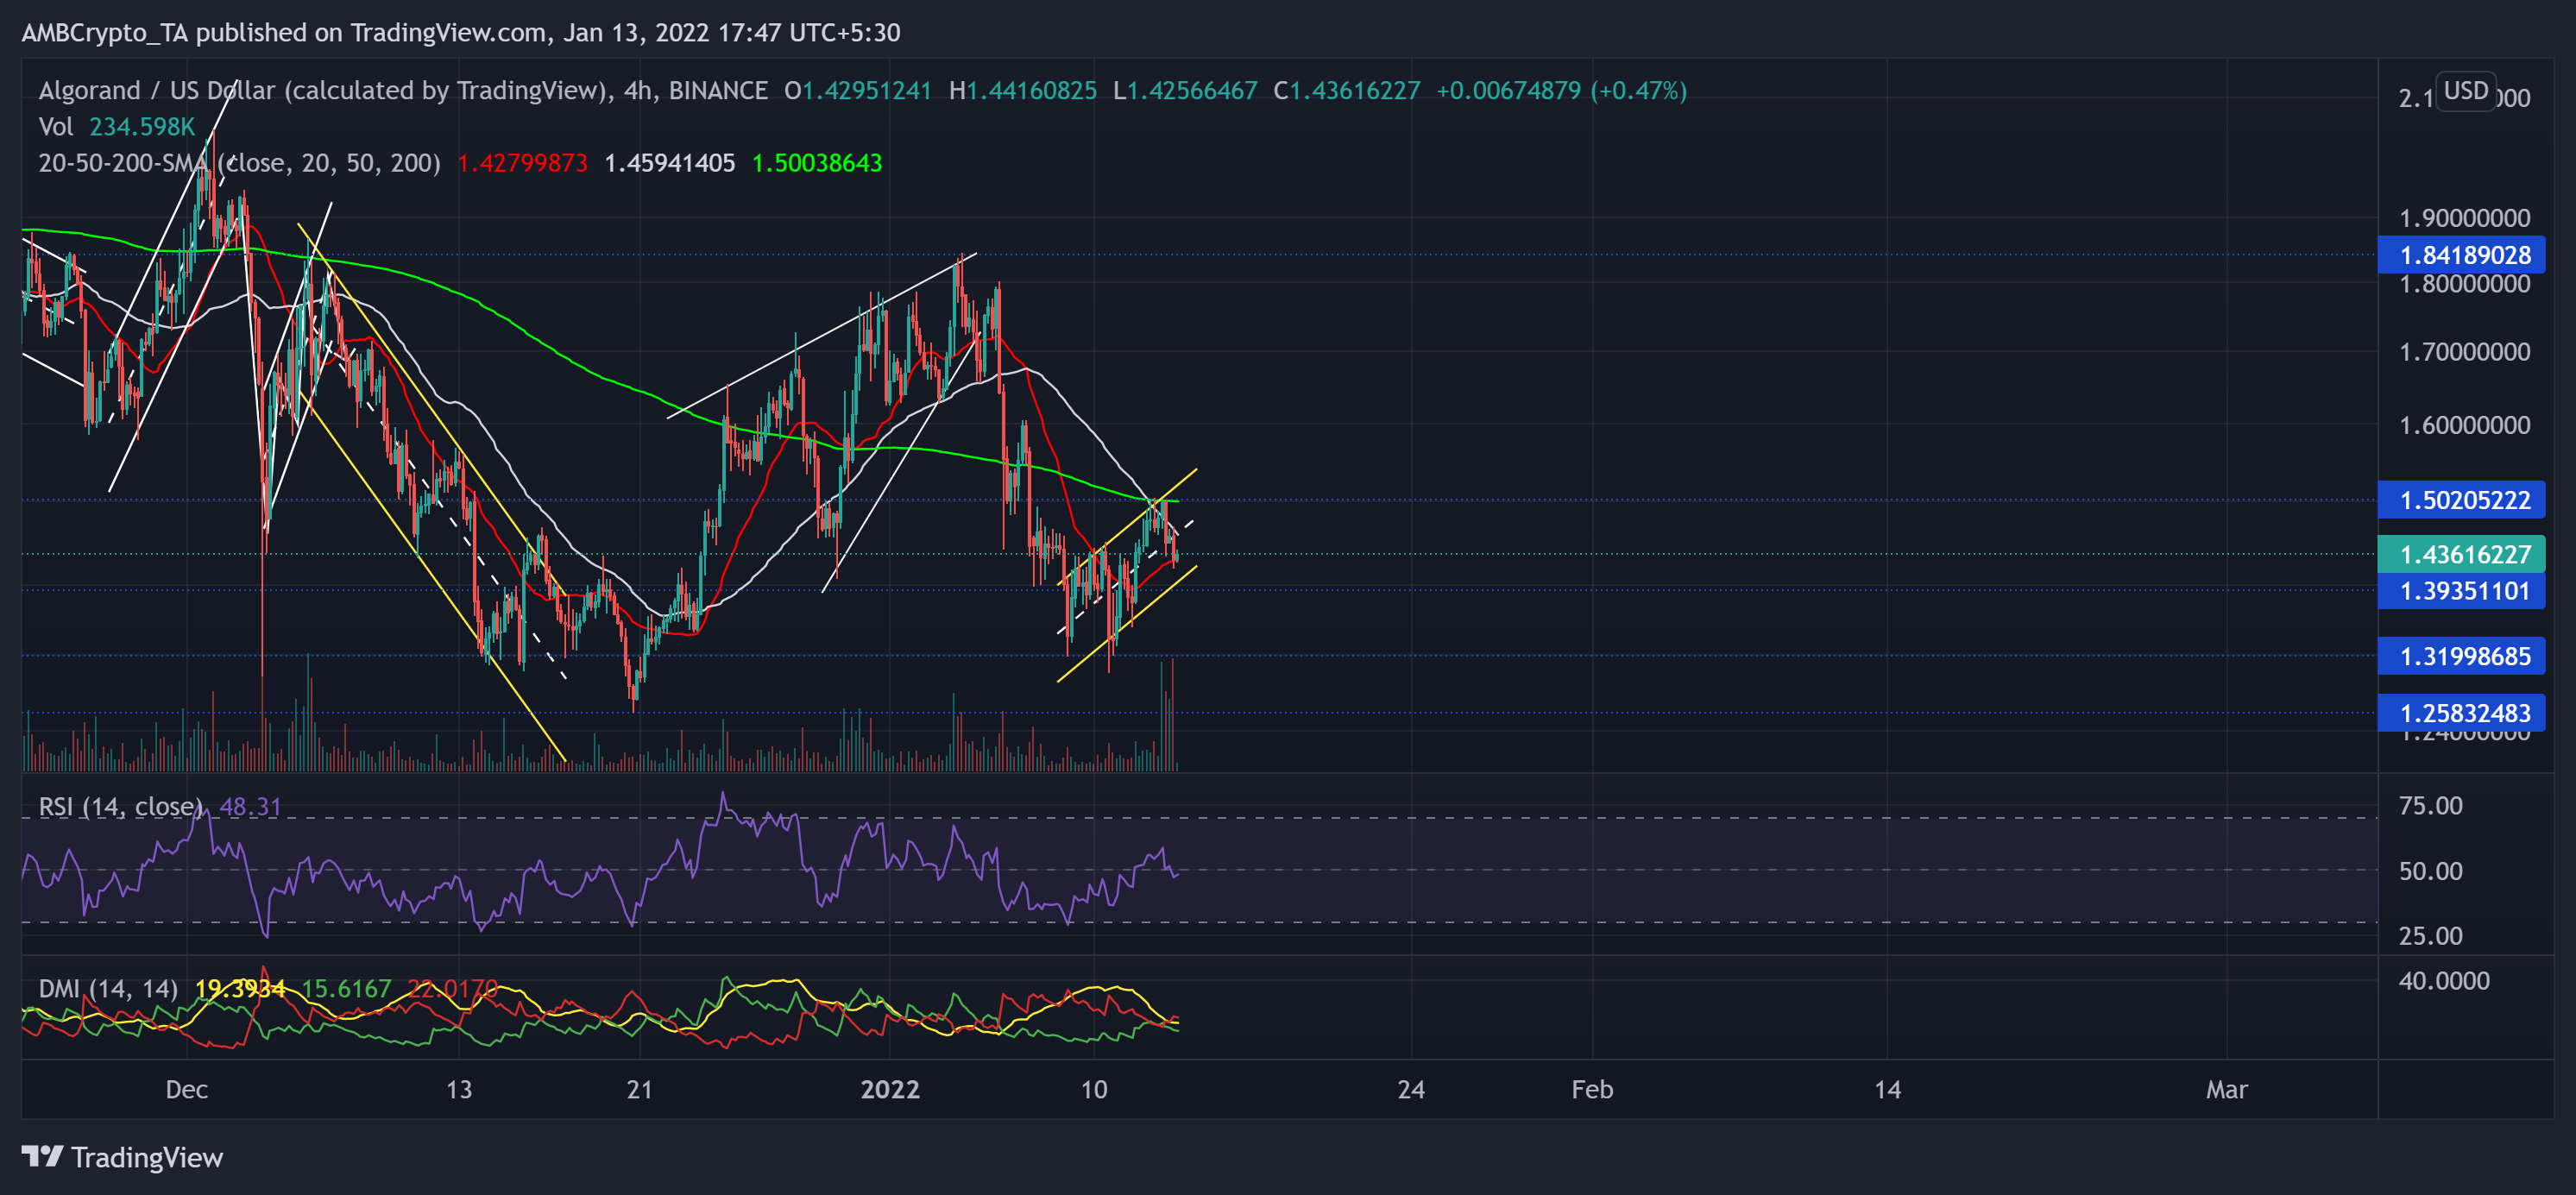
ALGO formed a rising wedge (white) on its 4-hour chart and saw an expected reversal from the $1.84-mark. The 5 January sell-off acted as an impetus to this trajectory as the alt lost nearly 30% of its value until 10 January.
Since then, ALGO saw a decent recovery attempt as it flipped the 20-SMA (red) from resistance to support. The immediate testing point for the bulls now is the $1.5-level.
At press time, ALGO traded at $1.436. The RSI stood at the 48-mark after an uptrend. Meanwhile, the DMI supported the bears, but the ADX displayed a weak directional trend. Also, the recent pullback volumes have been higher than buying volumes, giving the bears a slight edge.
Filecoin (FIL)
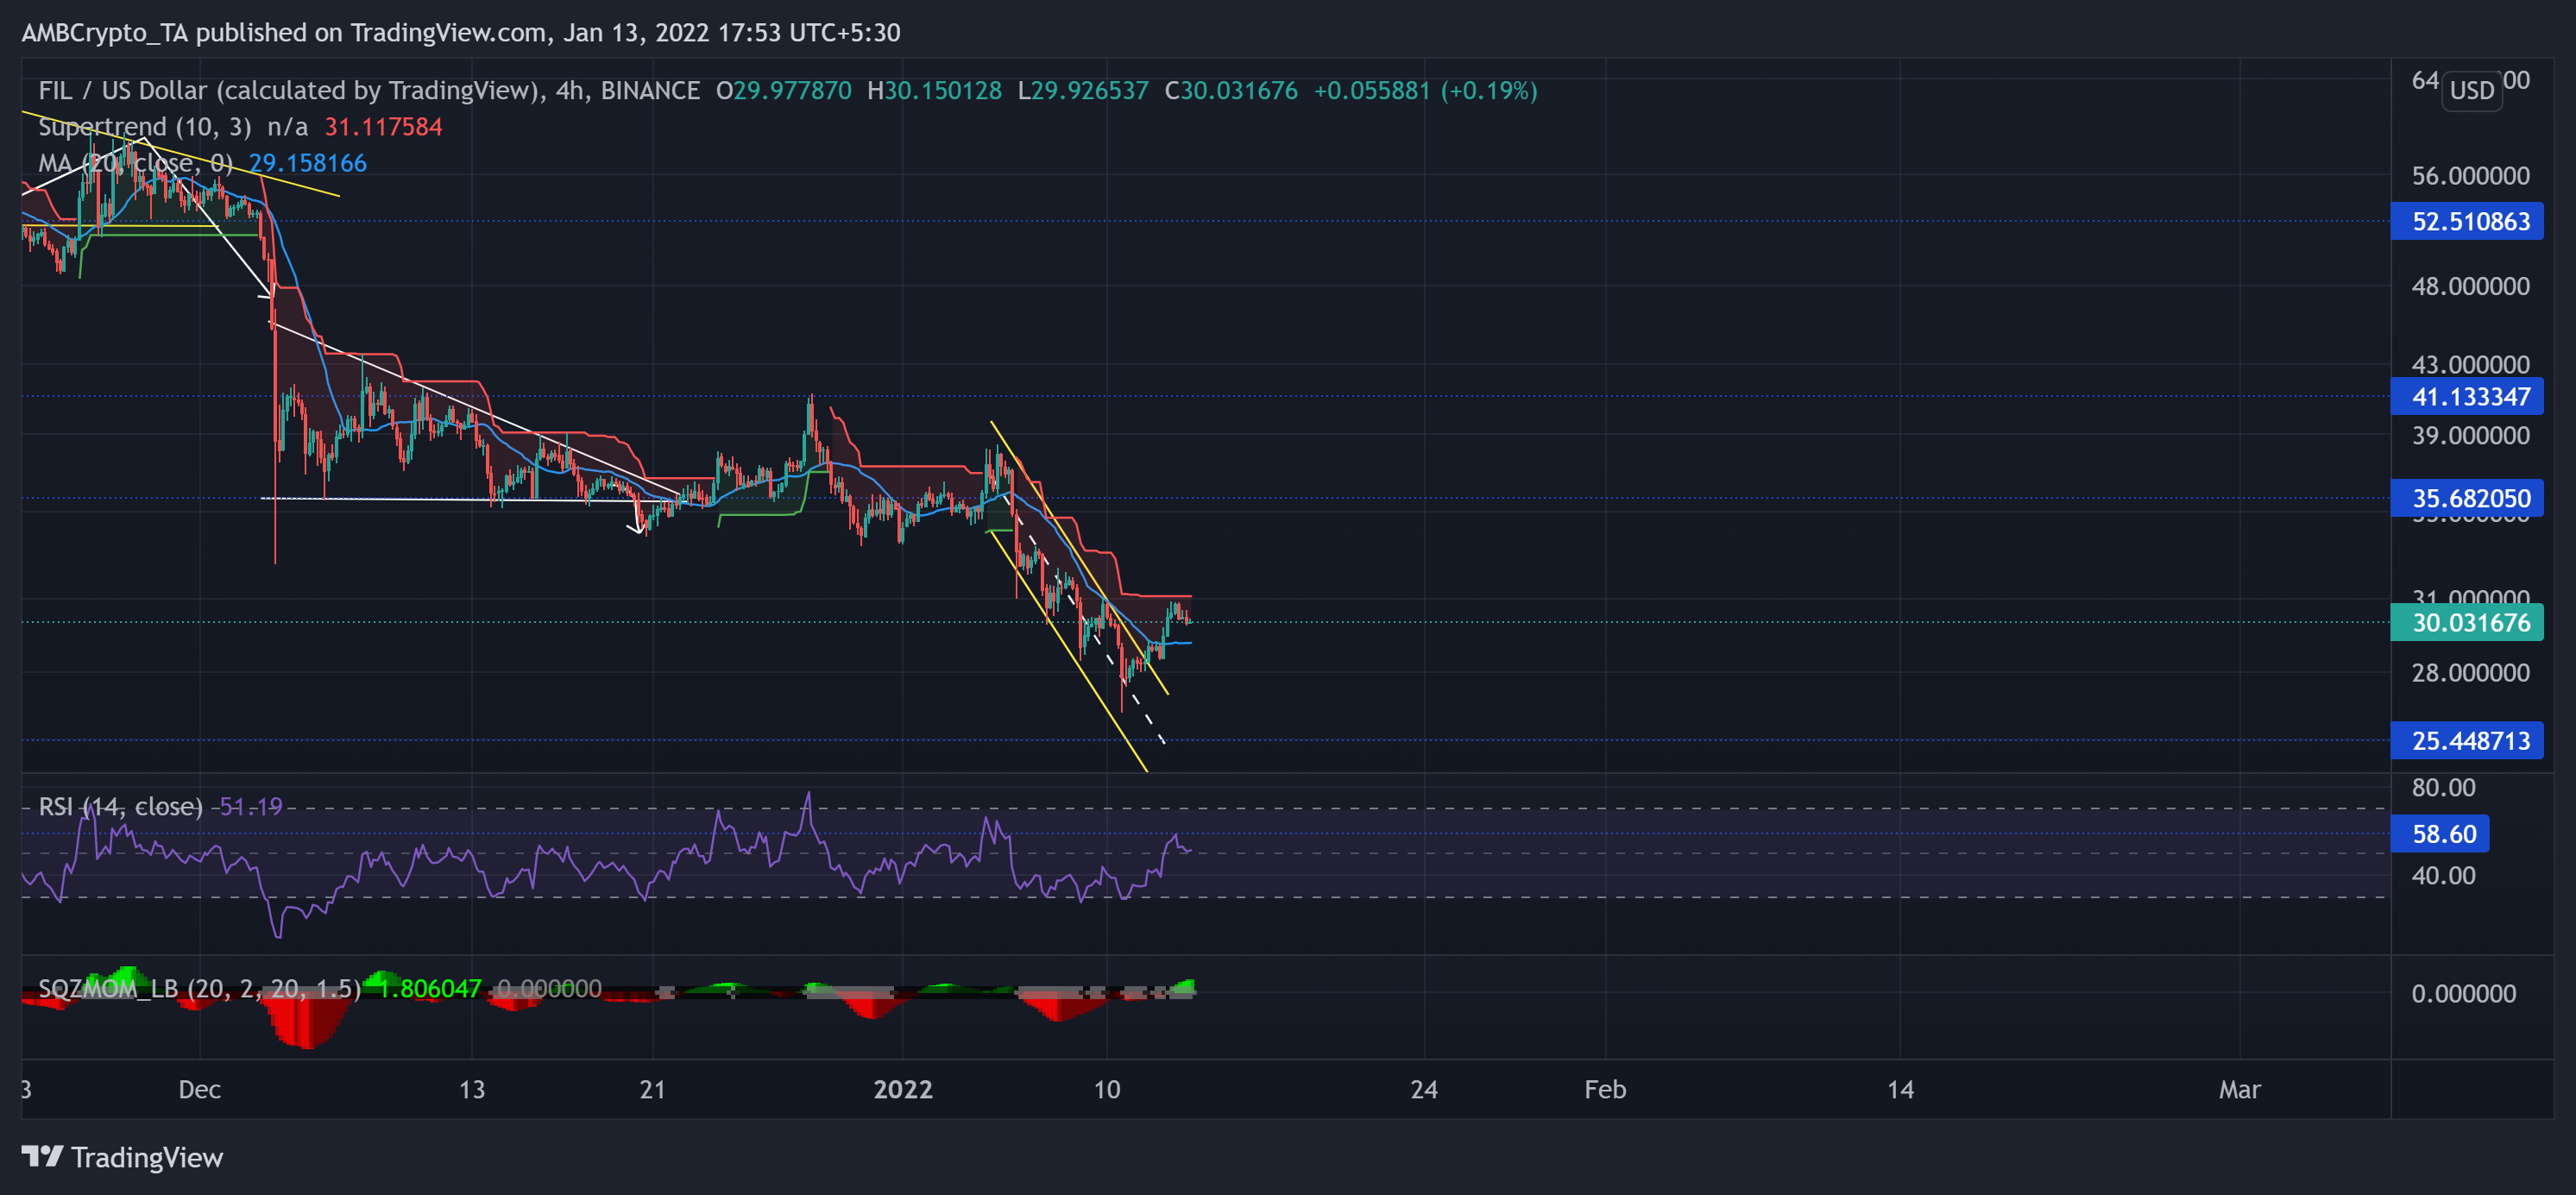
The alt saw a 31.97% retracement (from 5 January) from the crucial $35-mark resistance (previous support). On its 4-hour chart, FIL saw a descending channel (yellow) breakout over the past day.
The 14.4% recovery (from 10 January low) helped the alt to stall the heightened sell-off situation. However, considering the long-term bearish tendencies, the Supertrend preferred the sellers. The immediate testing support now stood at the 20-SMA (cyan).
At press time, FIL traded at $30.03. The RSI finally crossed the midline and tested the 58-mark resistance before a marginal dip. Moreover, the Squeeze Momentum Indicator indicated a high volatility phase by flashing grey dots.