Cardano: Assessing the odds of ADA’s near-term price revival

Disclaimer: The findings of the following analysis are the sole opinions of the writer and should not be considered investment advice
Since hitting its ATH, Cardano (ADA) has downturned and practically swayed below its 20-50 EMA. The decline proved to be alarming for the bulls as they failed to defend the critical $0.94-mark.
Assuming the willingness of the bulls to keep a foothold on the 13-month-long support near the $0.843-$0.824 range, ADA should aim for near-term revival. While the price seemed skewed towards the ‘cheaper’ side of the Bollinger Bands, ADA positioned itself to test its 20 EMA (red) before a slight pullback to its long-term support.
At press time, the altcoin was trading at $0.835.
Cardano Daily Chart
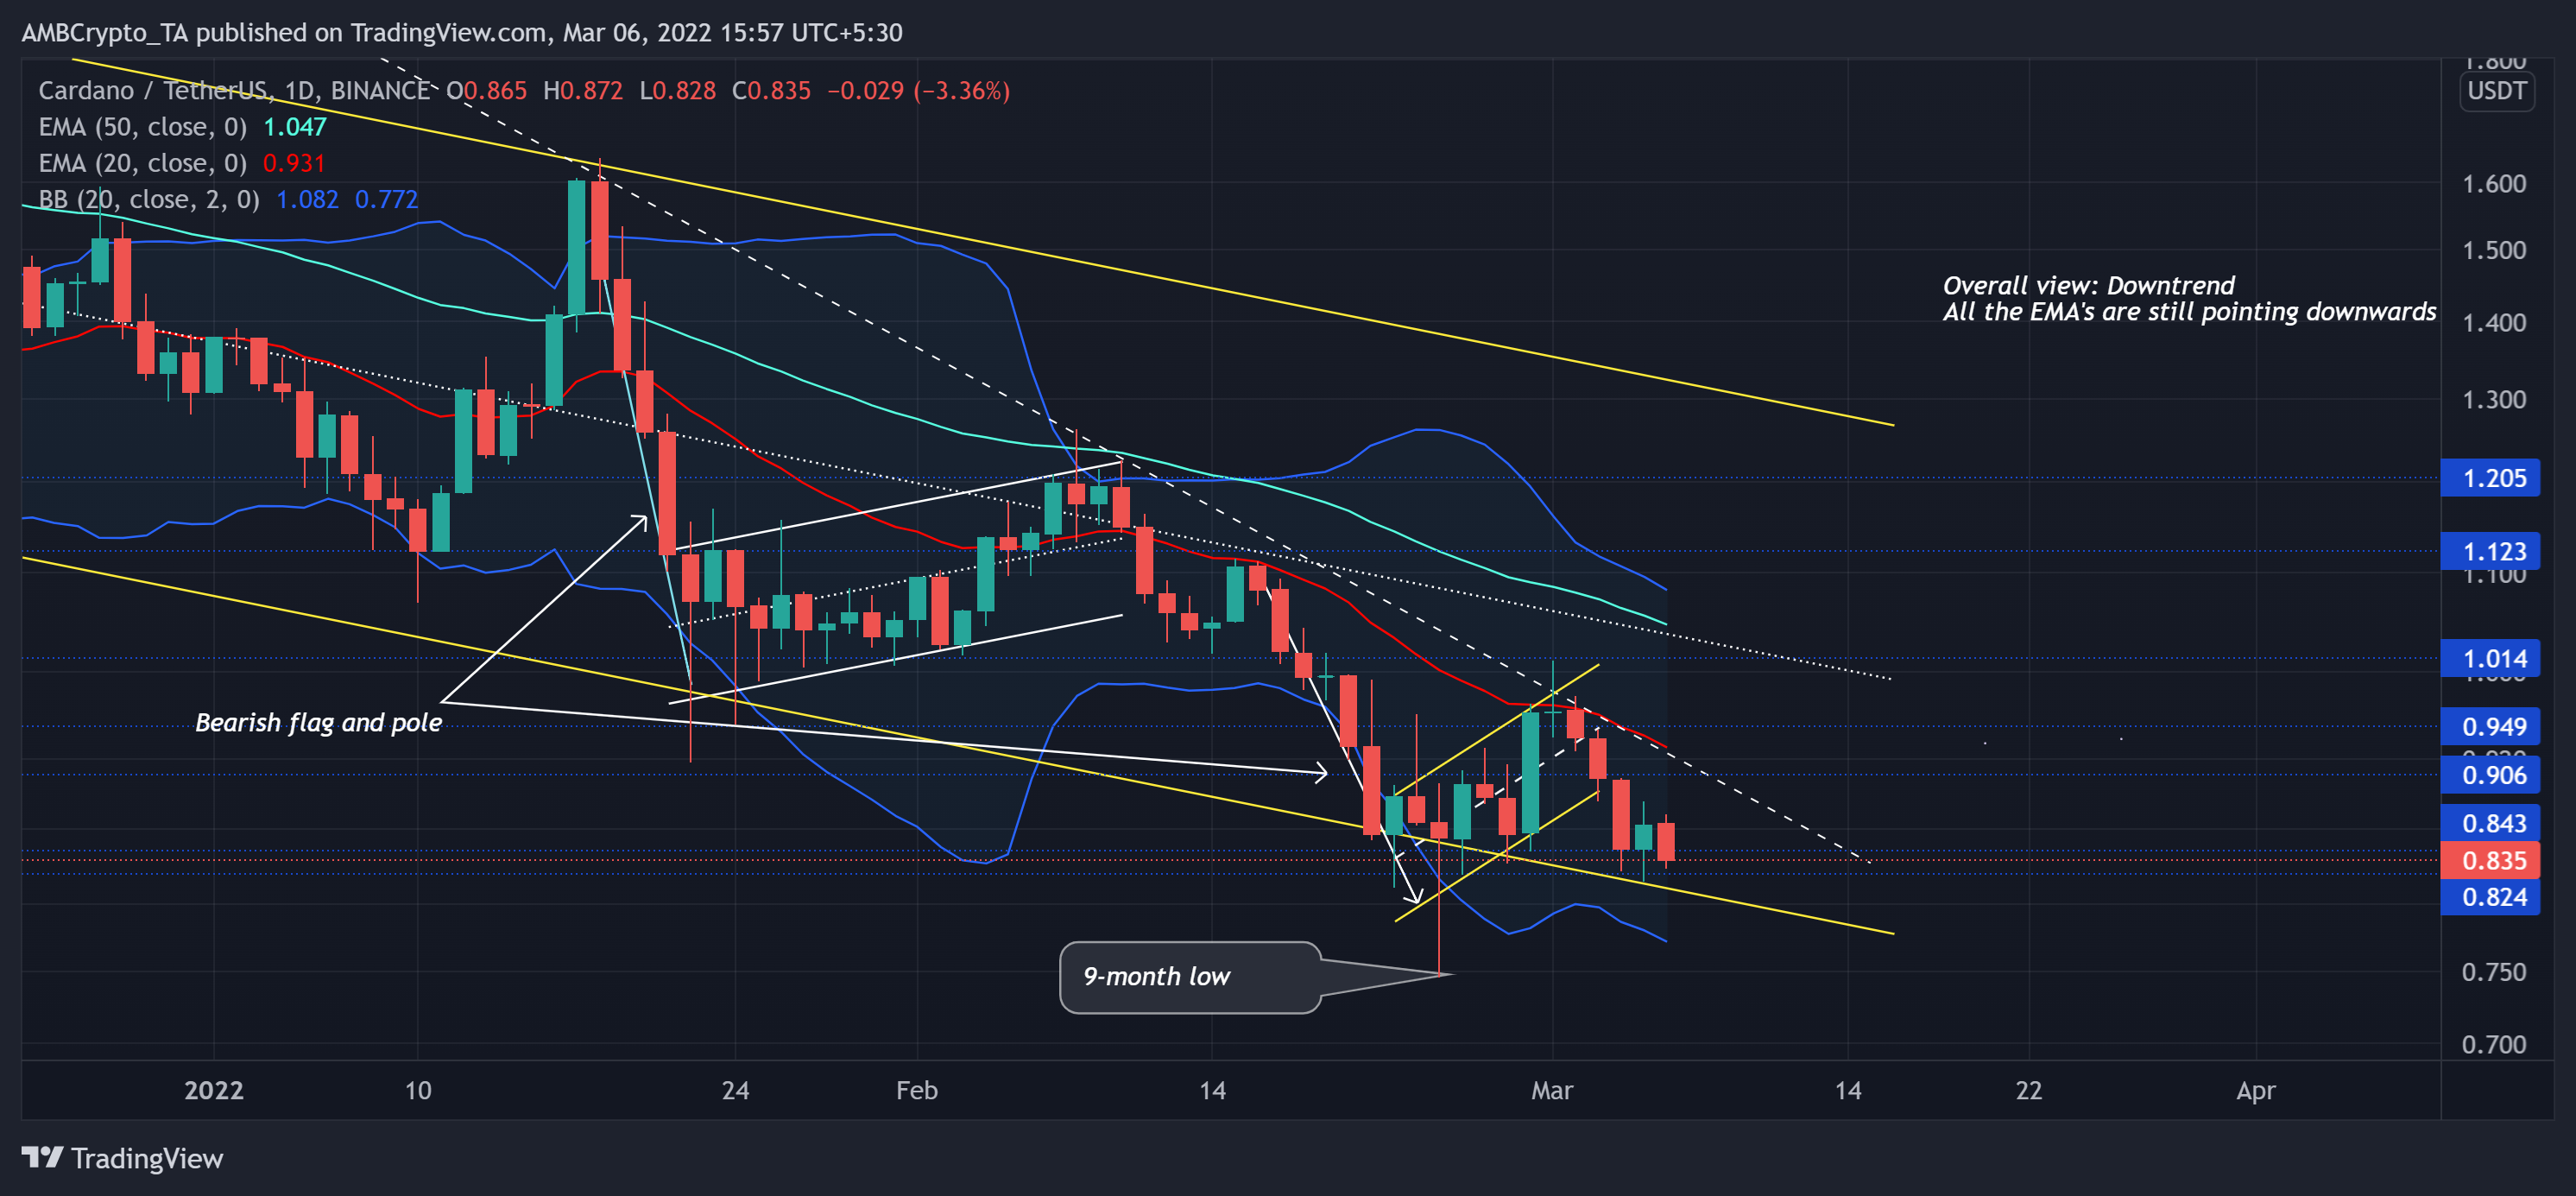
ADA formed a six-month-long descending channel (reversal pattern, yellow) while the alt was on a steep downtrend. Furthermore, it has lost over 72% of its value since its ATH and formed two bearish flags over the last two months.
Consequently, it fell towards its 9-month low on 24 February while the buyers stepped in to defend the $0.82-level. Interestingly, this level of support has stood as a testing floor for nearly 13 months. In the last two days, the bearish flag breakdown kept testing this support level while the bulls rejected lower prices.
From here on, a test of the $0.82-level would be likely before ADA revives itself to test its seven-week trendline resistance (white, dashed). A close above the $0.9-level would be vital to open recovery gates to exit its steep near-term downtrend. Should the bulls dwindle, a close below the lower trendline of the long-term down-channel could fuel a fallout.
Rationale
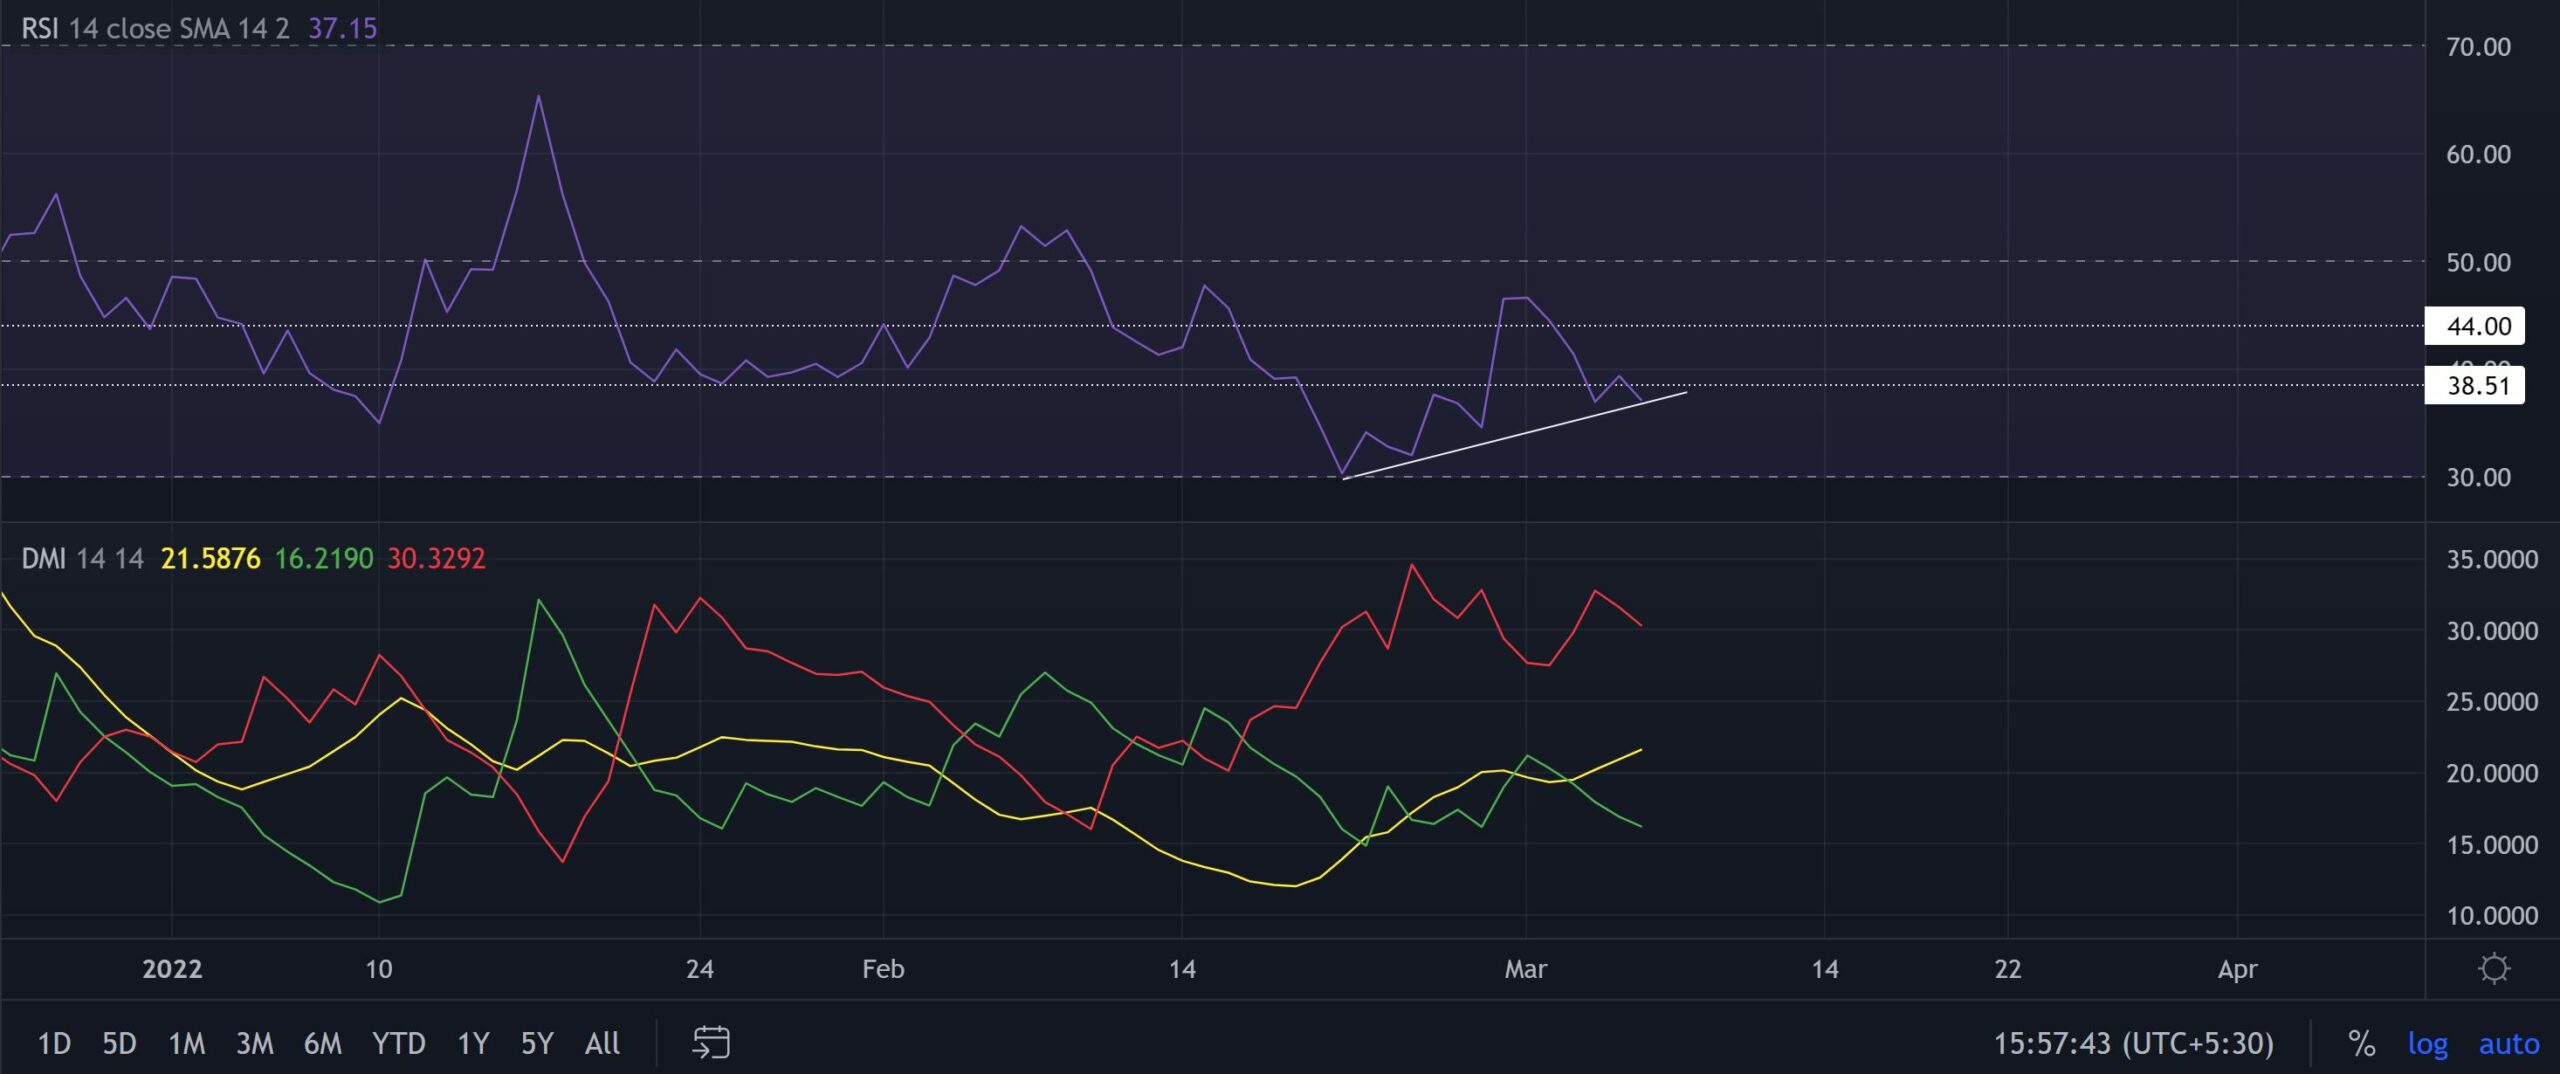
The RSI favoured the bears after it lost the 38-point level. Also, for the past 12 days, the price action has been testing the $0.843-level while the RSI witnessed higher troughs. This reading reaffirmed a recovery possibility from its immediate support range.
Also, the gap between the DMI lines seemed overstretched. This justified near-term bearish movements before the distance between the lines tighten.
Conclusion
Considering the confluence between the higher troughs of the RSI and the overstretched position of its EMAs and DMI, a revival towards $0.9 seems likely in the days to come.
Moreover, traders/investors should keep a close eye on Bitcoin’s movement as ADA shares a 77% 30-Day correlation with the king coin.