Cardano, Avalanche, CRV Price Analysis: 10 January

Yet again, the onus was on the king coin to alter the wider sentiment after entering the $41,000-zone. While an ‘Extreme fear‘ wave still lurked in the crypto market, Cardano and Avalanche poked their multi-week lows on 8 January. Also, the Curve DAO token fell below its three-month Point Of Control.
Cardano (ADA)
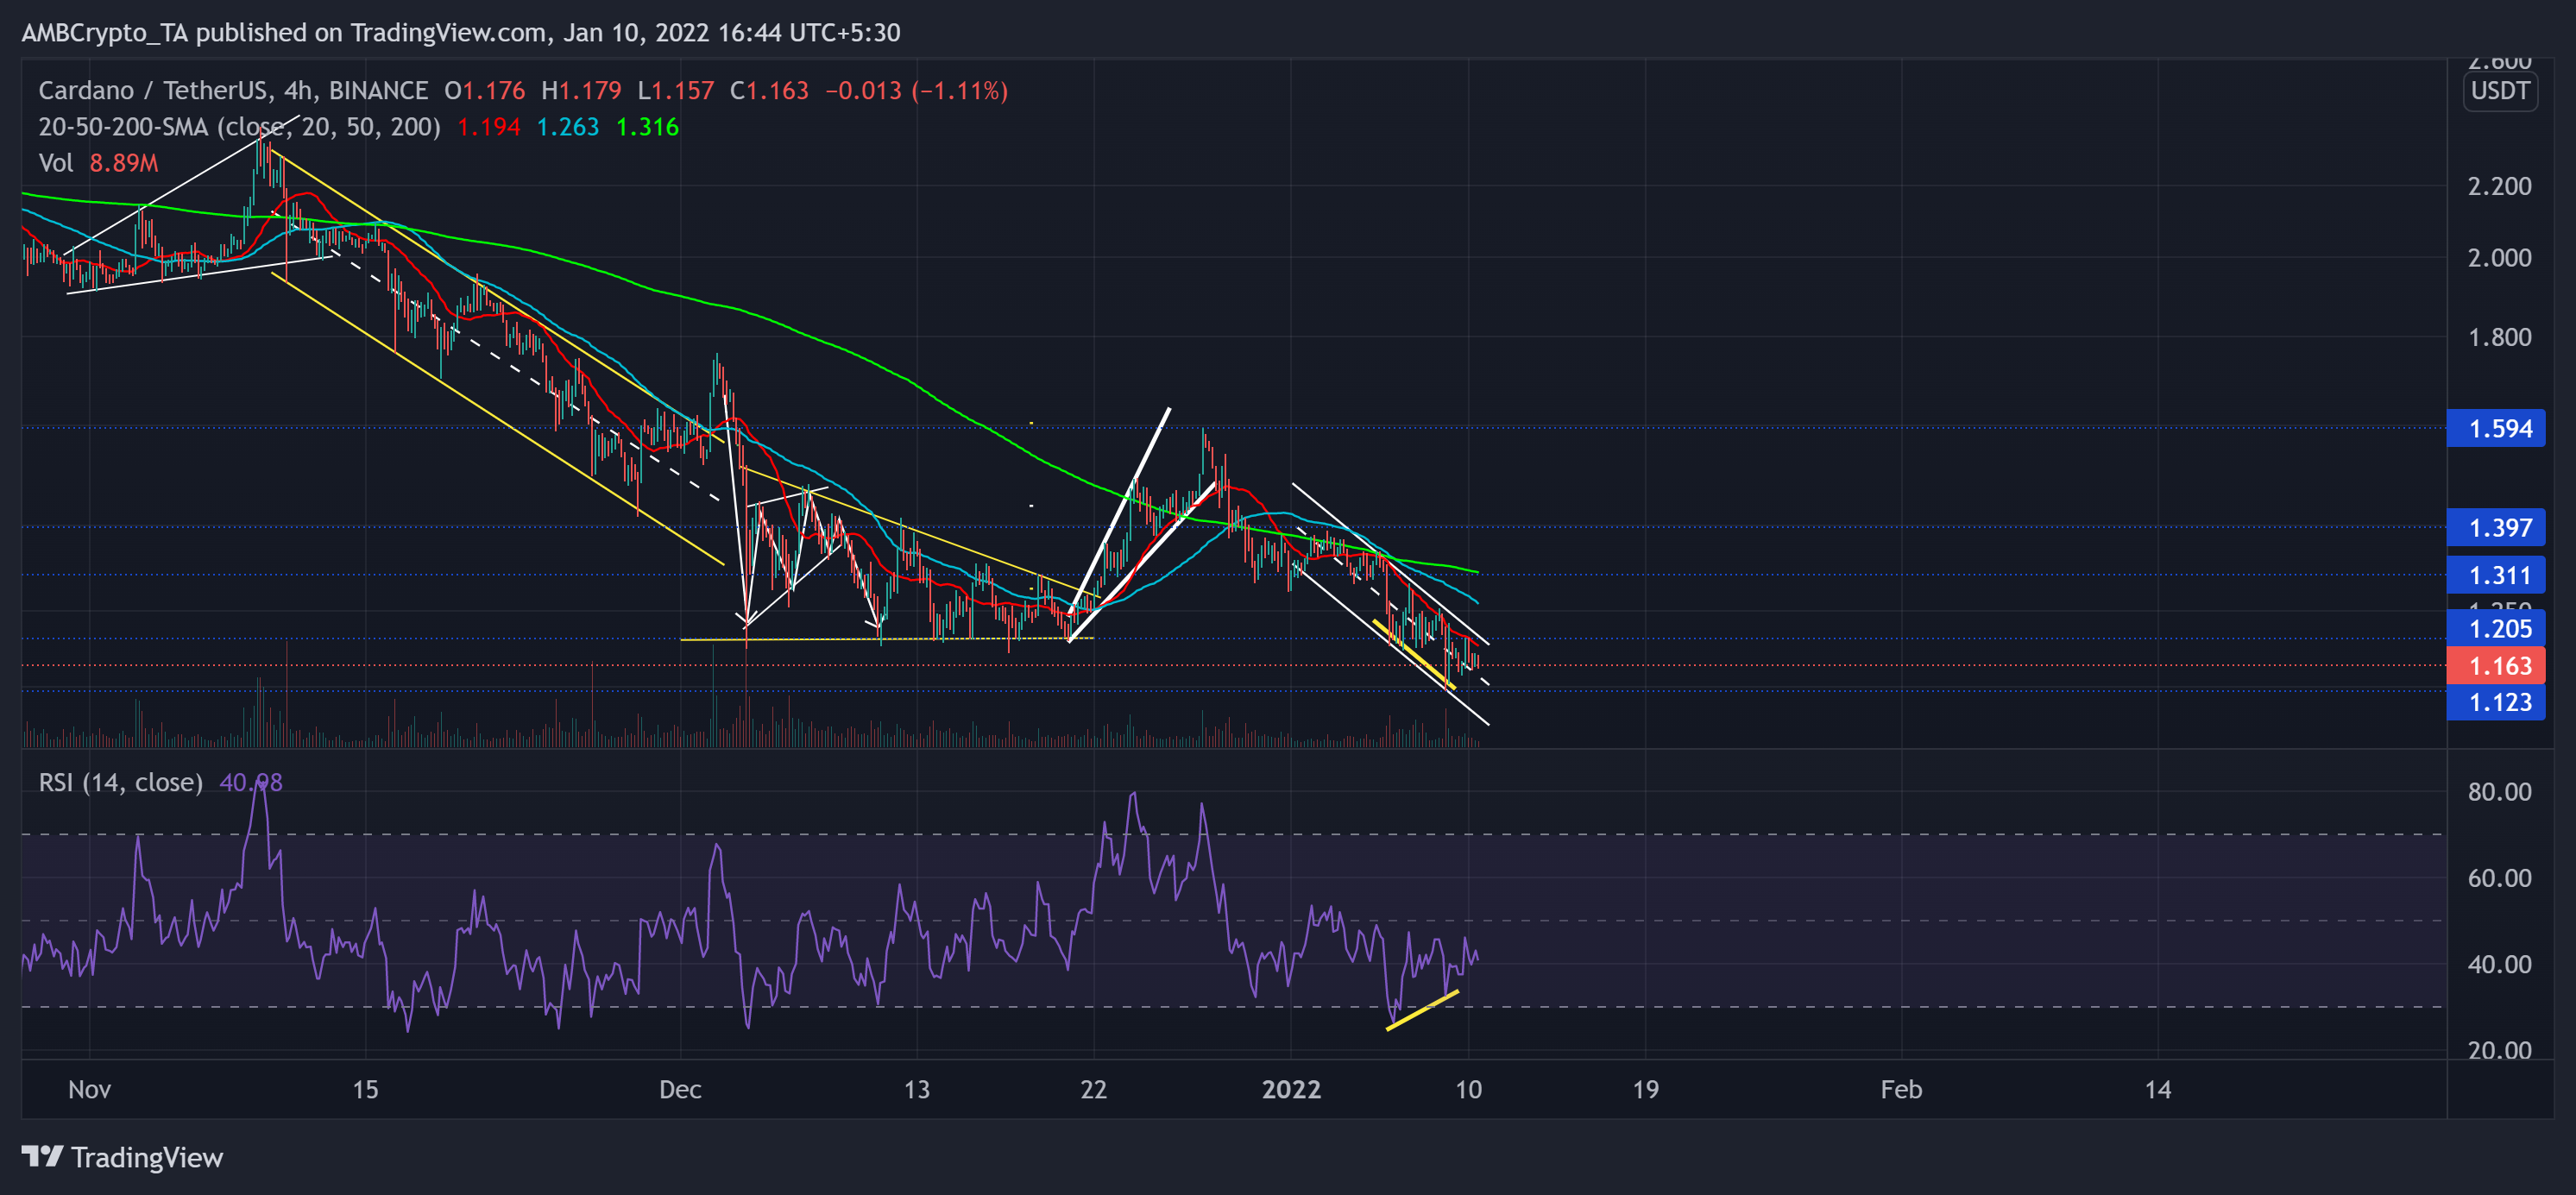
ADA’s ascending broadening wedge (white) reversed from near the $1.59 resistance level. As a result, it saw a 29.63% retracement (from 27 December high) until it poked its five-month low on 8 January.
The down-channel (white) oscillation flipped the $1.2-mark from support to immediate resistance. The bulls had ensured this level since July but succumbed to a broader sell-off. Now, immediate resistance stood at the upper channel that coincided with the 20-SMA near $1.2.
Recently, the pullback volumes exceeded the buying volumes, revealing a strong bearish perception. At press time, ADA traded at $1.163. The RSI was in an uptrend and saw a bullish divergence (yellow) with price action. But still strived to close above the half-line.
Avalanche (AVAX)

After the bearish flag breakdown, AVAX halted the downfall at the 61.8% Fibonacci support. As it reversed, it registered a monstrous 67.8% ROI (from 13 December low) to poke its three-week high on 22 December. Since then, the alt saw a 37.58% retracement and poked its three-week low on 8 January.
Now, AVAX attempted to reclaim the 38.2% Fibonacci support after witnessing strong resistance at the $88.7-mark. The 20-SMA (red) fell below the 50-200 SMA, displaying a bearish comeback.
Any further retracements would find testing support at the $79.3-mark followed by the 61.8% level. At press time, AVAX traded at $87.2. The RSI found near-term resistance at the half-line while flashing bearish signs. Also, the DMI lines refused to crossover and continued to flash a selling bias.
Curve DAO token (CRV)
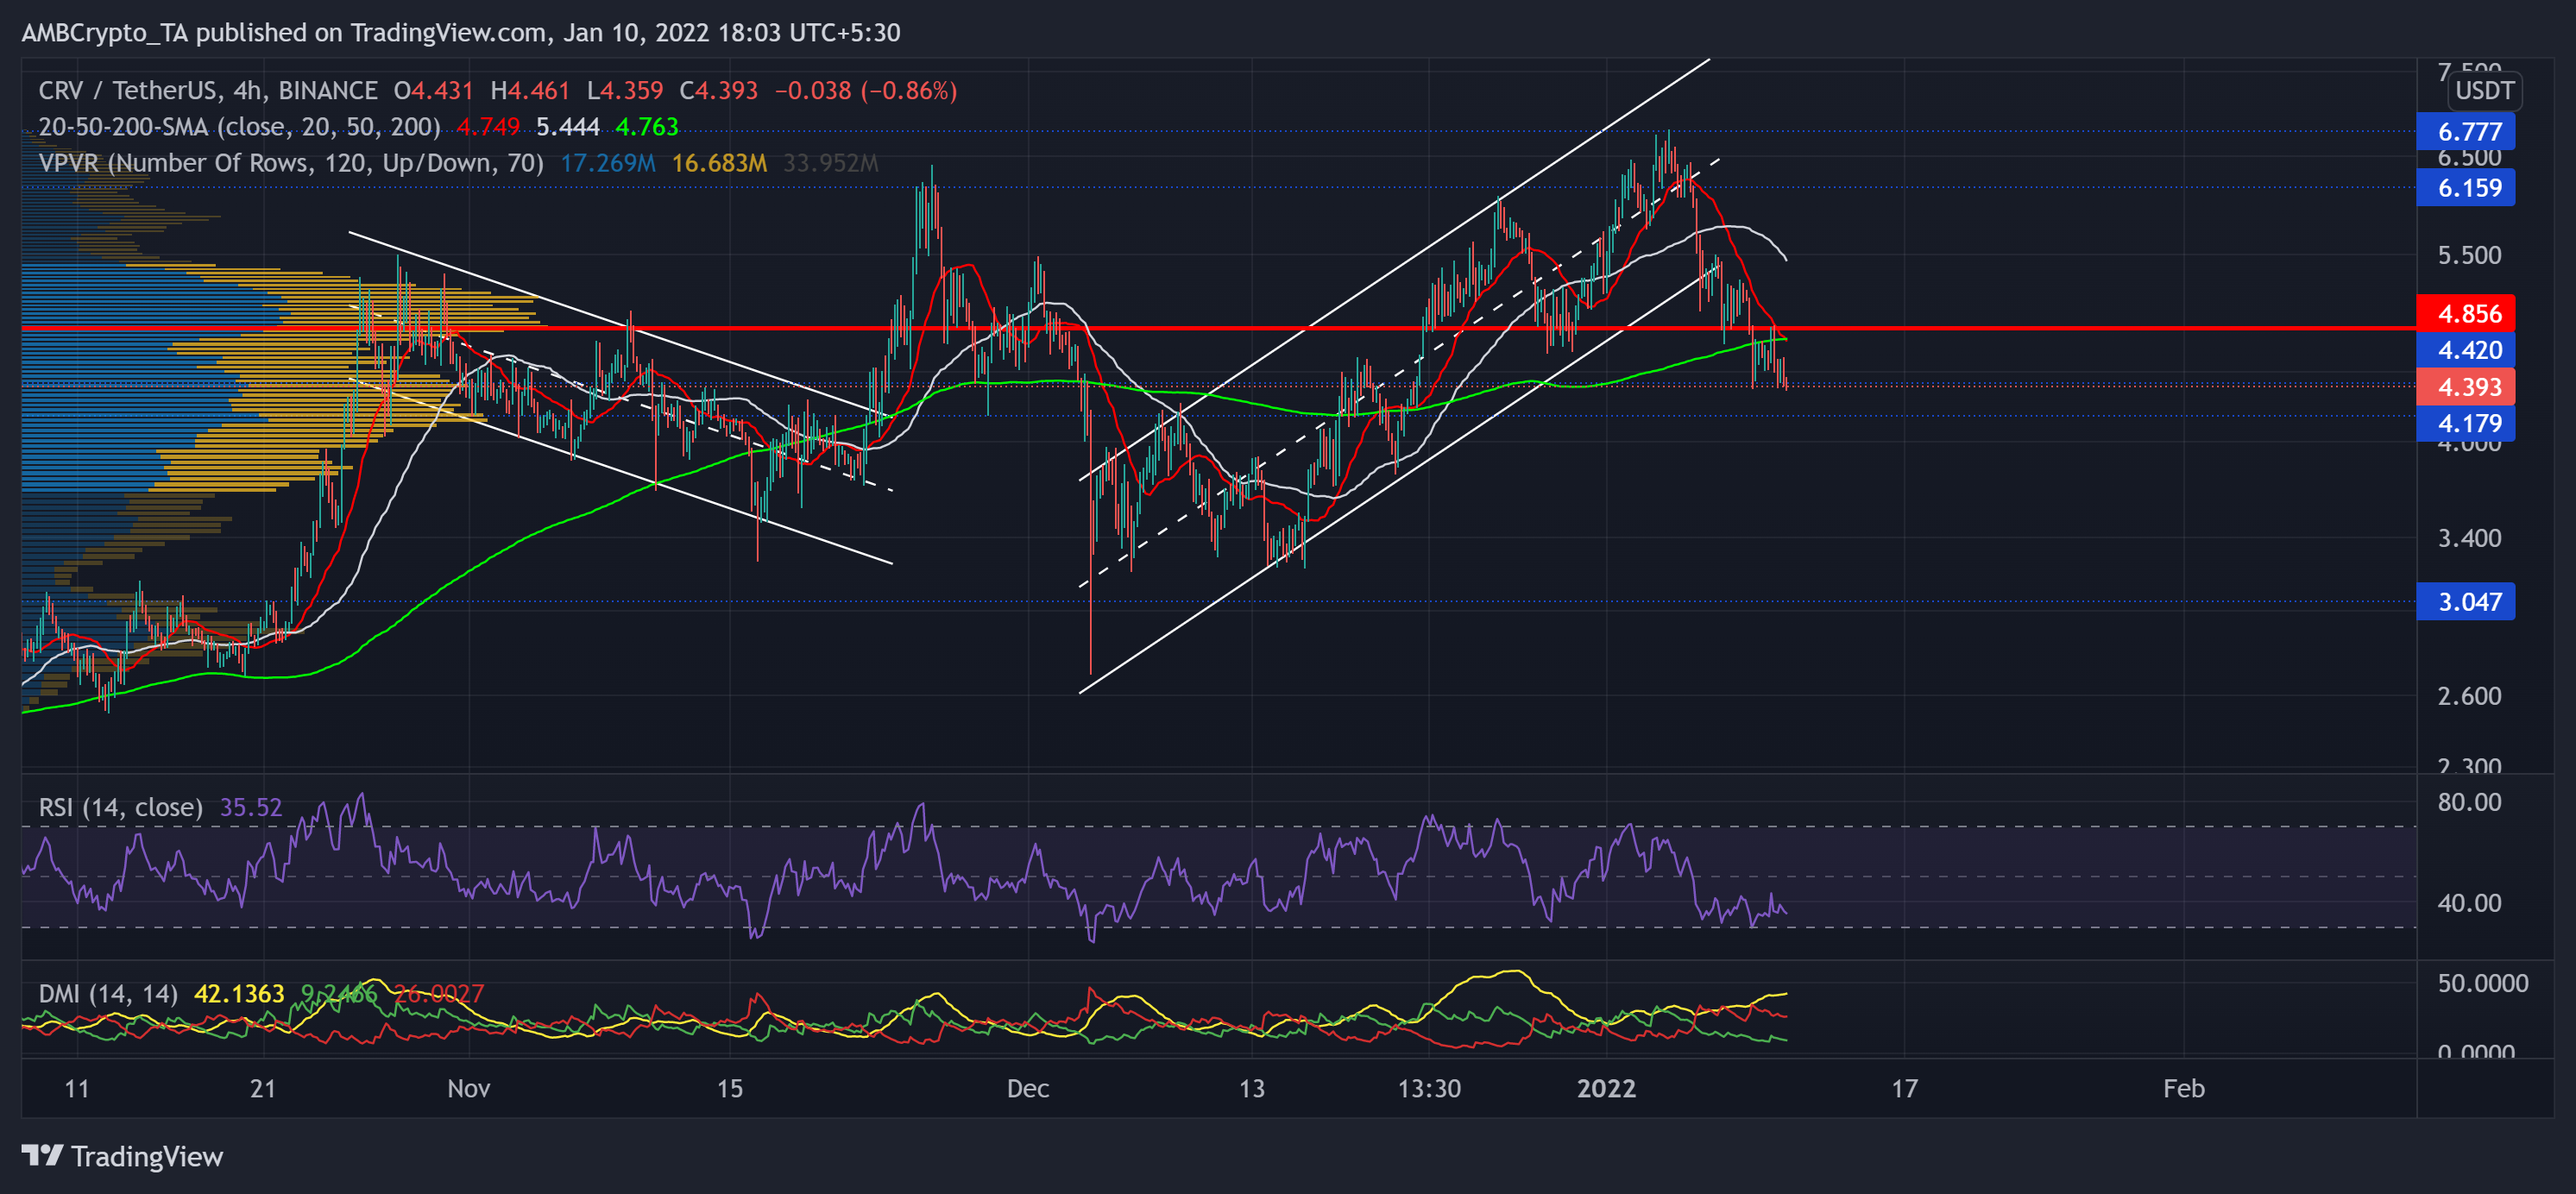
Since 22 October, the alt found an oscillating range between $6.159 and the $3.278-mark with the Point of Control (red) acting as equilibrium at the $4.846-level.
The recent up-channel (white) reversed after poking its 20-week high on 4 January near the long-term resistance. Over the past six days, the alt declined by 35.3% below its three-month Point of Control. Now, the 20 SMA (red) plunged below the 200 SMA (green) after nearly three weeks, hinting at increased bearish influence. The immediate testing support stood near $4.179.
At press time, CRV traded 91.7% below its ATH at $4.393. The RSI tested the oversold region thrice in the last four days but still showed no revival signs. To top it up, the DMI confirmed the previous analysis.


