Cardano, BAT, Dogecoin Price Analysis: 05 March

Cardano saw a bounce to $1.17, but this move did not yet confirm that ADA was on the road to recovery. On the contrary, Basic Attention Token and Dogecoin noted bearish momentum, a continuation of their short-term downtrend over the past few days.
Cardano [ADA]
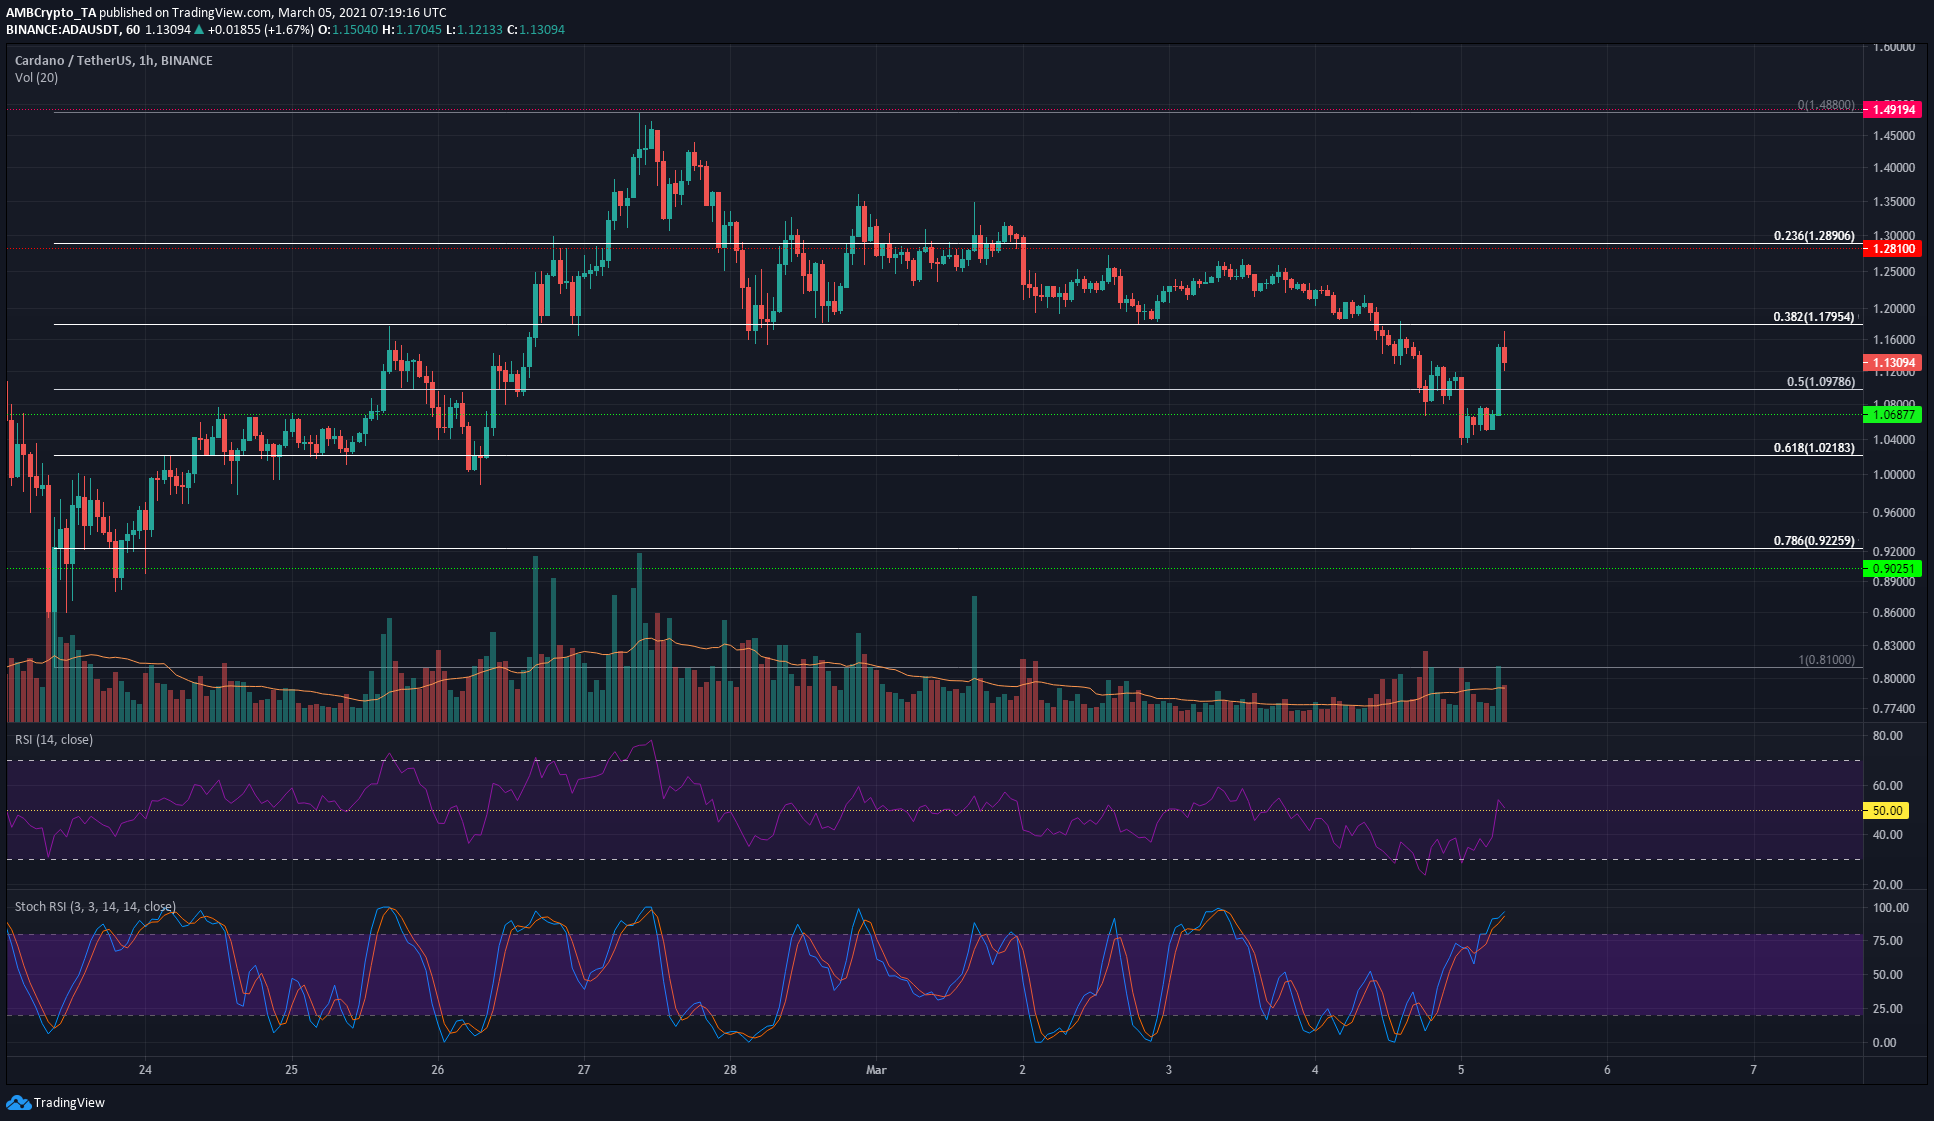
On the hourly chart, ADA appeared to have broken out of its steady downtrend as it registered a strong bounce from the $1.04-zone to touch $1.17 on the charts. The RSI climbed back above 50 but the Stochastic RSI was in overbought territory. The past few hours saw ADA register a bounce worth 12.6%, but it was likely to revert on the charts.
Longer timeframe charts pictured an oversold ADA and this could be nothing more than a brief relief rally. To lend credence to the notion of a recovery, ADA must rise above $1.18 and flip the retracement level from resistance to support.
Basic Attention Token [BAT]
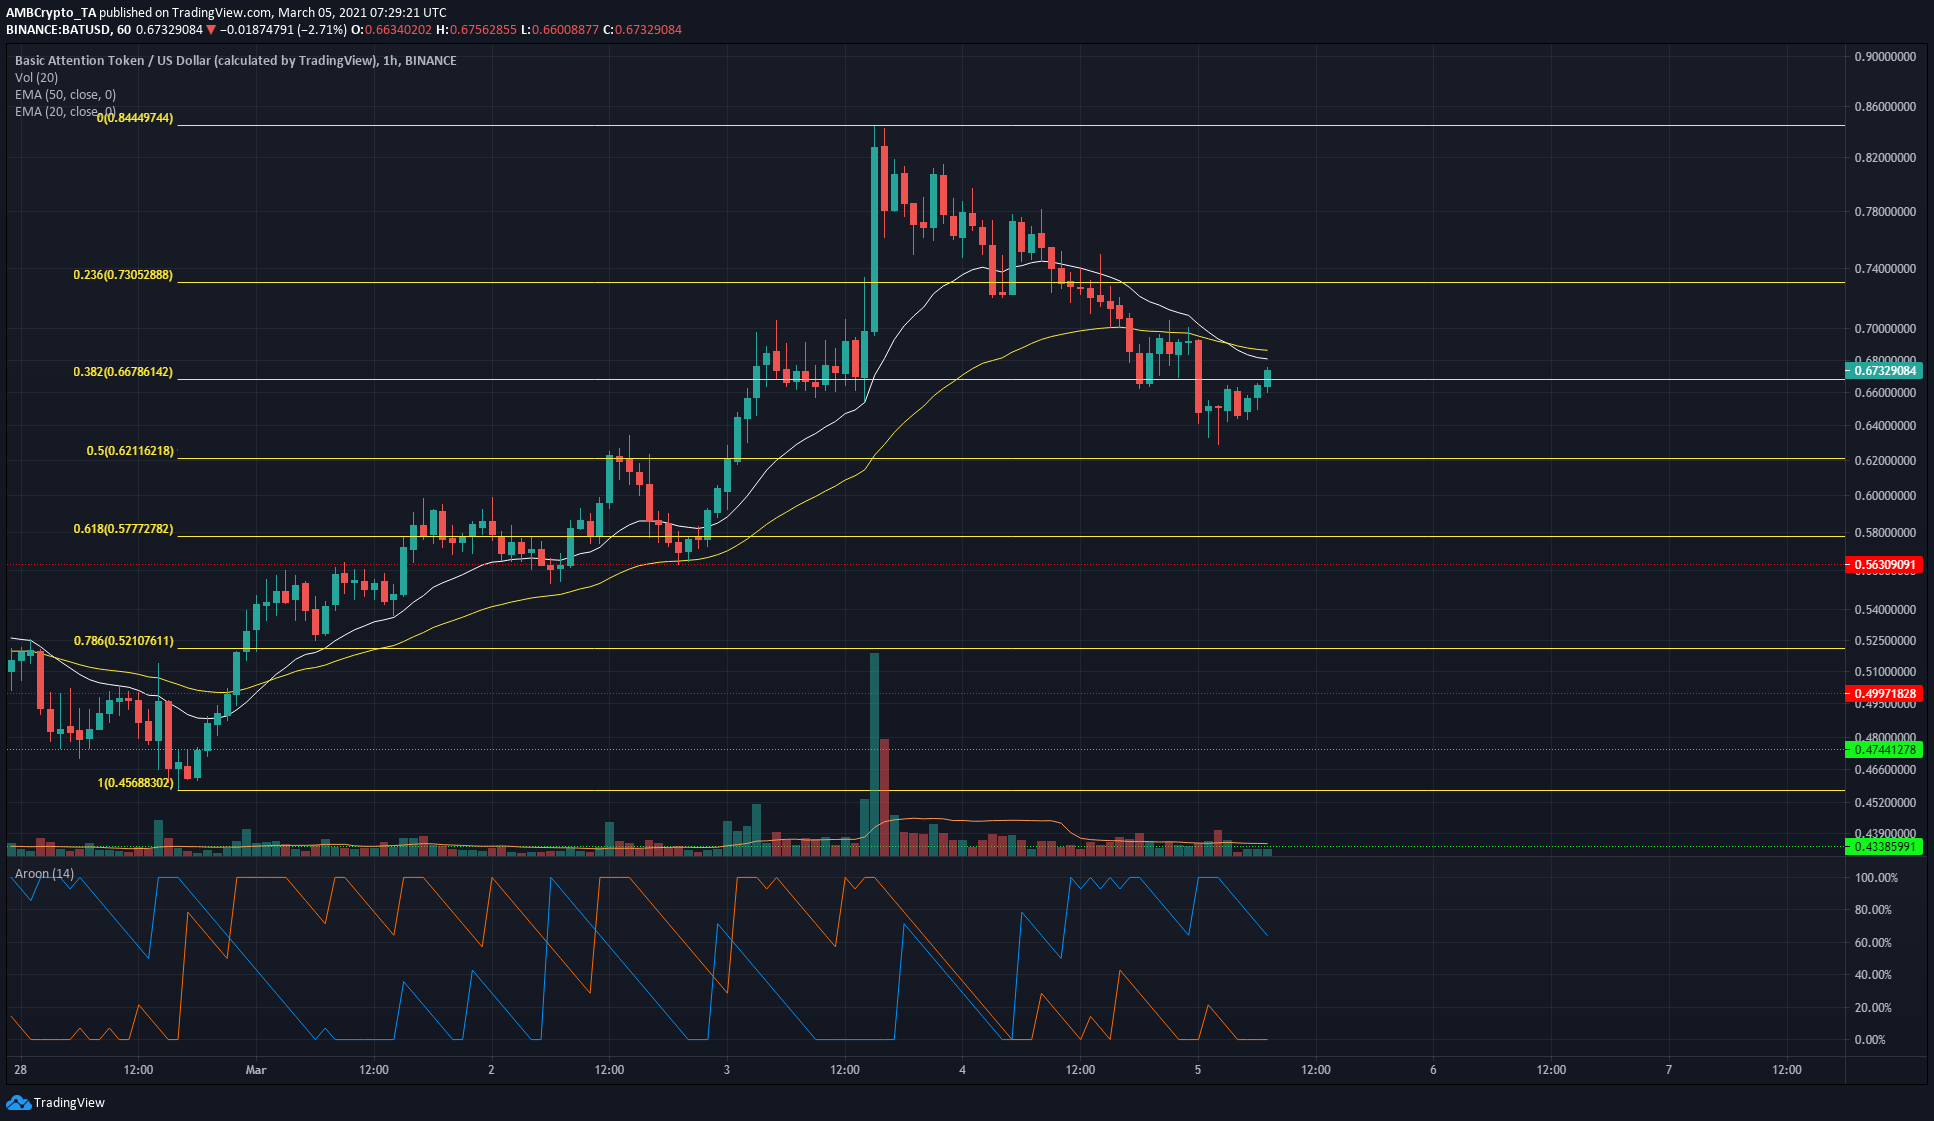
The Aroon indicator showed that a downtrend was in progress, with the Aroon down (blue) moving above the Aroon up (orange) to denote bearish behavior. There seemed to be an area of liquidity in the vicinity of $0.7, one that BAT could revisit before another move south.
The 20 and 50-period EMAs (white and yellow respectively) showed that momentum had flipped in favor of the bears. The Fibonacci retracement tool highlighted some areas of support for BAT.
Over the next few days, the $0.62 and $0.57 levels are likely to be tested as support, provided BAT faces selling pressure around $0.7 and is forced lower down the charts.
Dogecoin [DOGE]
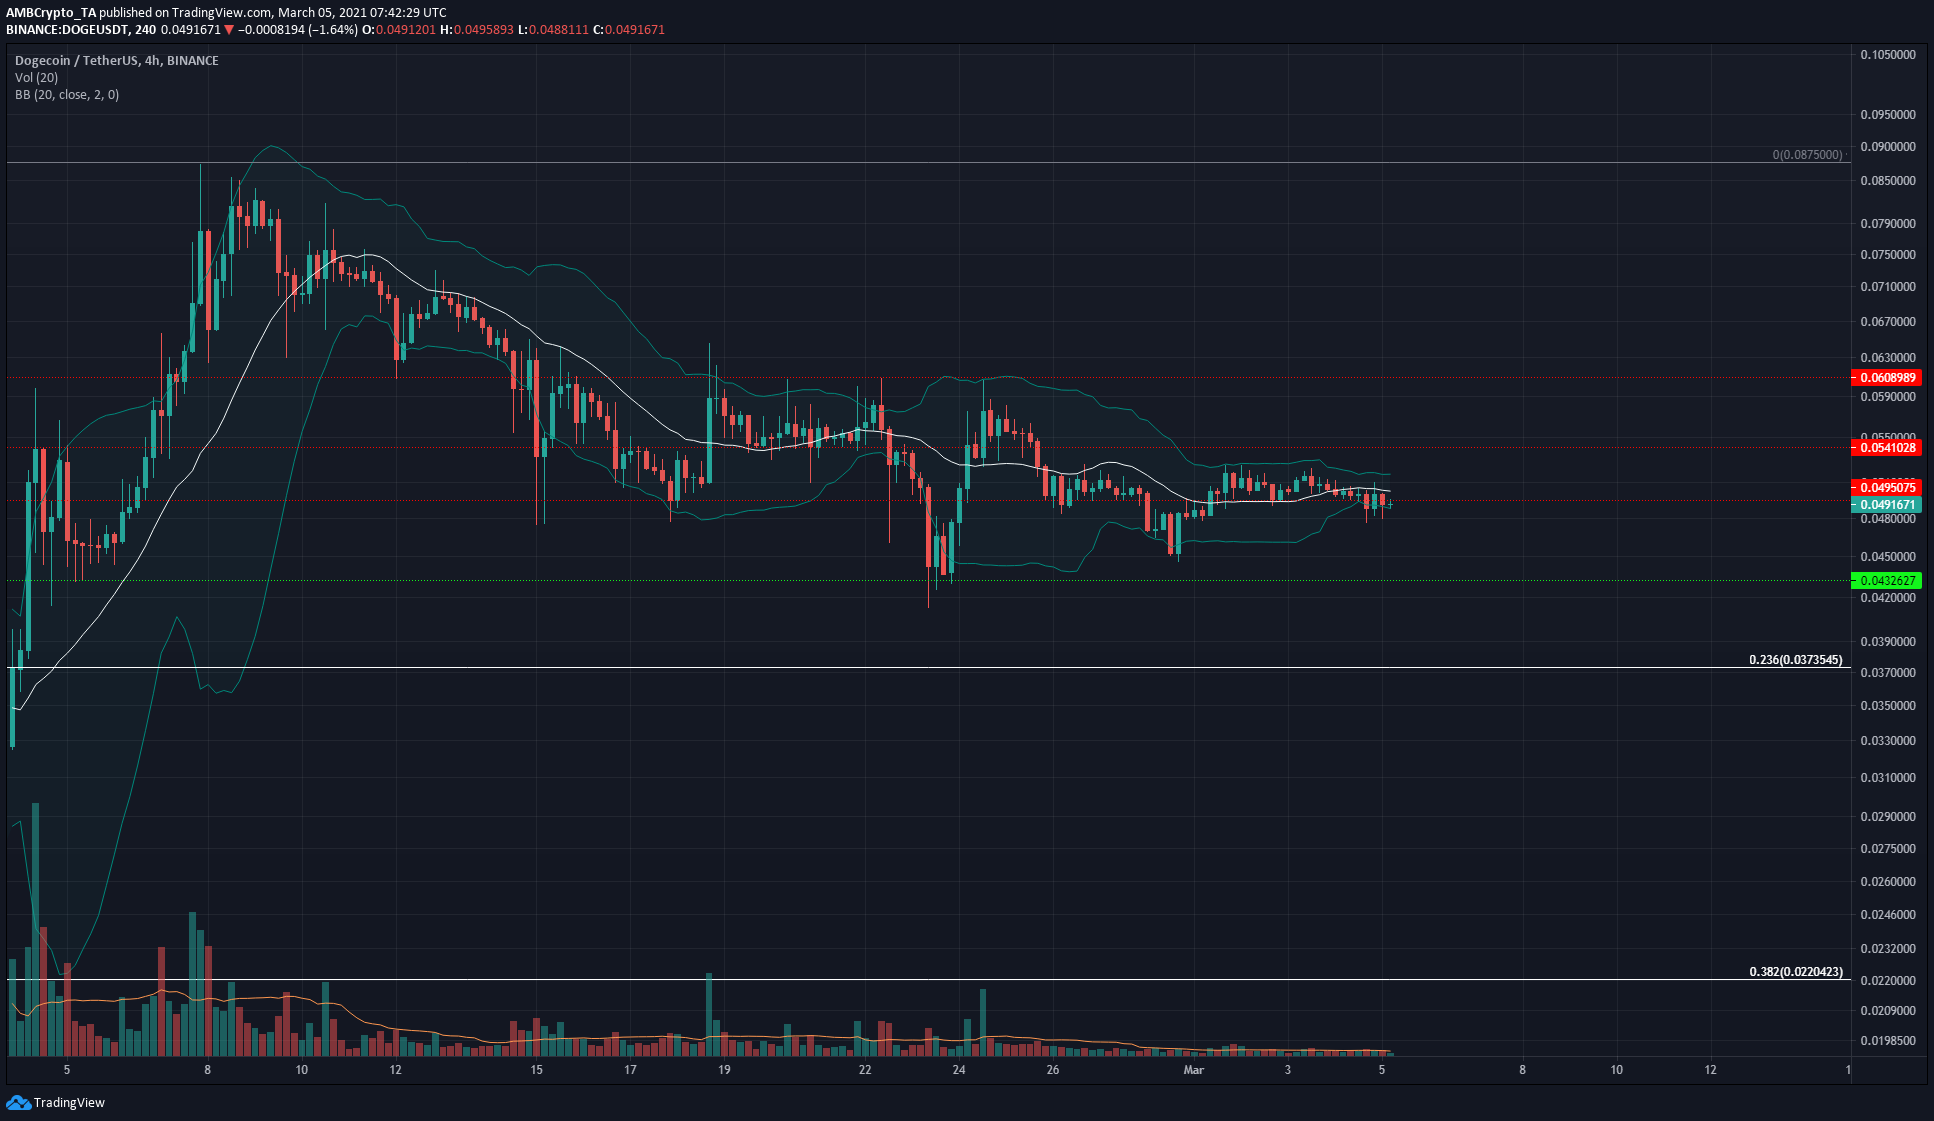
The trading volume, compared to the most recent surge for DOGE, was insignificant, while volatility has been considerable. Over the past few days, the price was observed to have swung by 10% from $0.0475 to $0.0525. The Bollinger Bands seemed to be expanding slightly over the past few trading sessions as well.
The important levels of $0.049 and $0.054 can be expected to act as resistance. Lower down the charts, $0.043 can offer a buying opportunity.
While the 4-hour chart showed that volatility was relatively low for DOGE, the lower timeframes suggested that DOGE was showing bearish momentum as it slipped under the $0.0491-mark.


![Rising bond yields put Bitcoin [BTC] at risk — a Fed rate hike could be next](https://ambcrypto.com/wp-content/uploads/2026/08/IMG_4752-e1785656382502.webp)