Cardano, Cosmos, FTX Token Price Analysis: 09 January

Cardano saw strong gains recently as its went past $0.17 and gain nearly 100% over the past week. The $0.28 mark had been defended from bearish pressure and a loss of this level could indicate further retracement for ADA. Cosmos established an uptrend over the past few days, although its volatility was quite pronounced. FTX Token flinched in the face of selling pressure but more time is needed to establish if FTT would retrace further or rise back above its previous ATH.
Cardano [ADA]

Source: ADA/USDT on TradingView
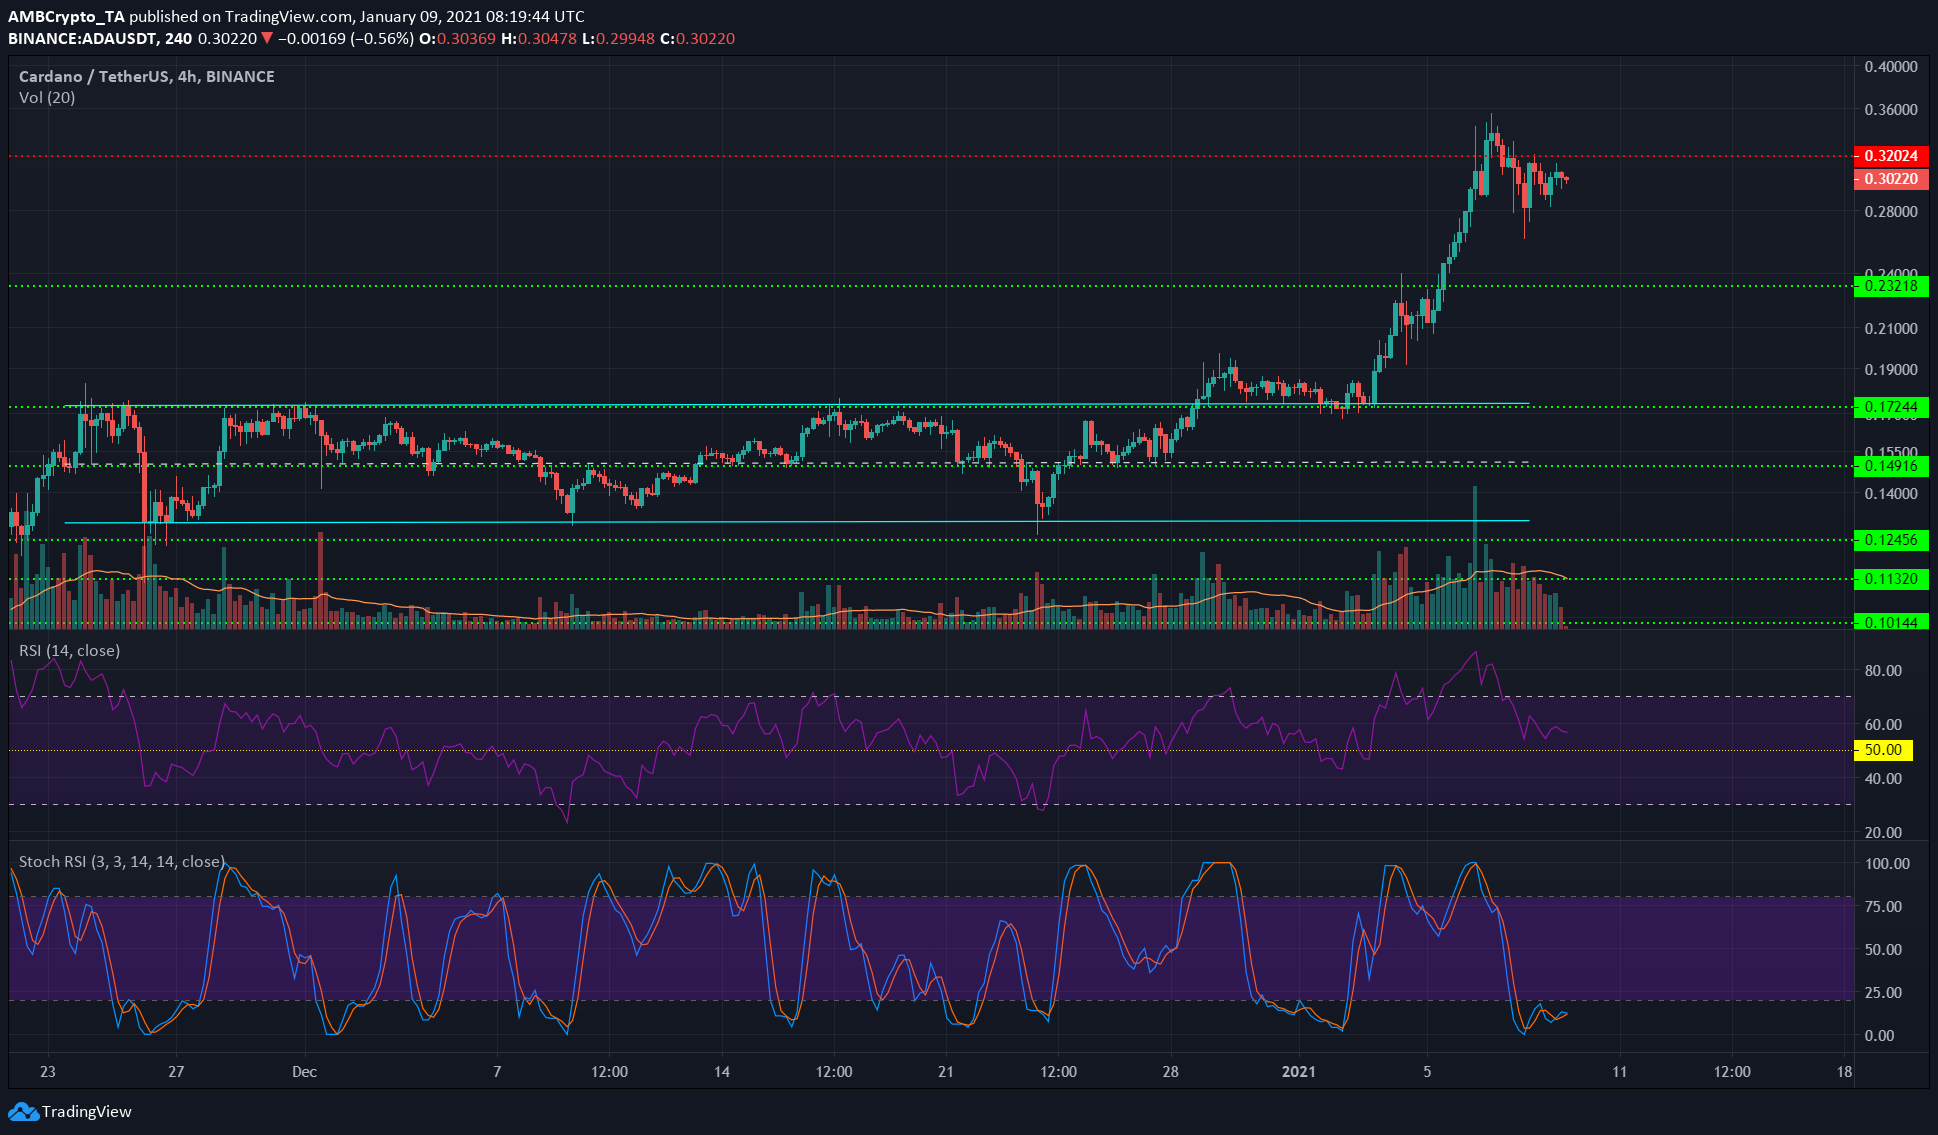
Cardano broke out of a range it was trading in (cyan) and retested the $0.172 level a few days ago. Subsequently, ADA climbed the charts to record a session close at $0.338, a gain of 95% since the retest.
The price was pushed back beneath the $0.32 level as the RSI also moved back toward neutral 50, while trading volume also decreased to indicate some consolidation. Further retracements can occur for ADA.
A move beneath $0.28 was resisted by the bulls over the past few trading sessions. This indicated that a close below $0.28 could trigger further losses for ADA.
The Stochastic RSI was in the oversold region, and if, alongside price, the RSI also begins to climb as trading volume picks up, another move to the upside would be signaled.
In other news, Project Catalyst, the first stage of the Voltaire roadmap, was kicked off and $500,000 worth of ADA was committed in fund3 to distribute between proposers, voters, and community advisors.
Cosmos [ATOM]

Source: ATOM/USD on TradingView
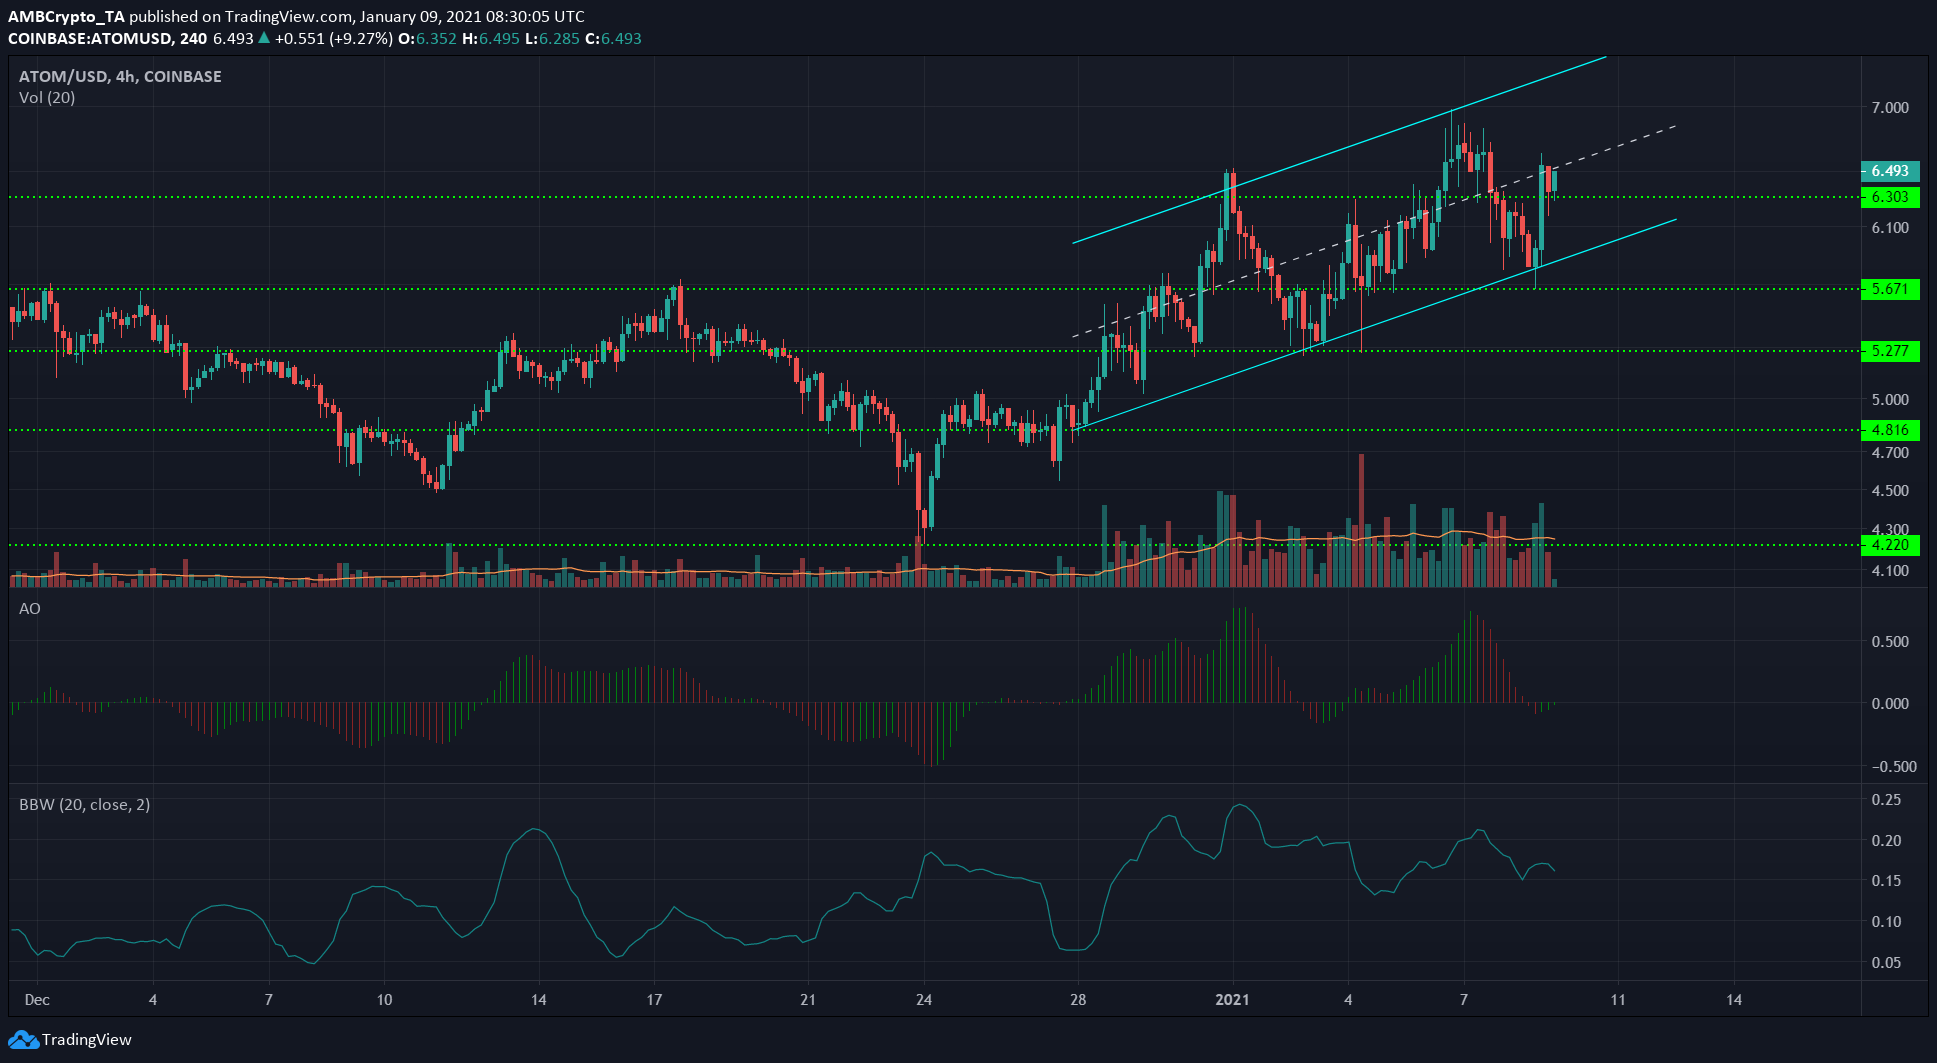
ATOM formed an ascending channel (cyan). The Awesome Oscillator showed some choppiness over the past few days, but the bullish momentum has been stronger than the brief crossovers of the AO into bearish territory.
The Bollinger Band Width indicator was also rising, agreeing with the observation that observed volatility has been on the rise.
However, an uptrend has been established for ATOM. Important levels of resistance hence lie at $7 and $7.8, with support at $6.3 and $5.6, with the channel boundaries also expected to act as support and resistance.
FTX Token [FTT]

Source: FTT/USD on TradingView
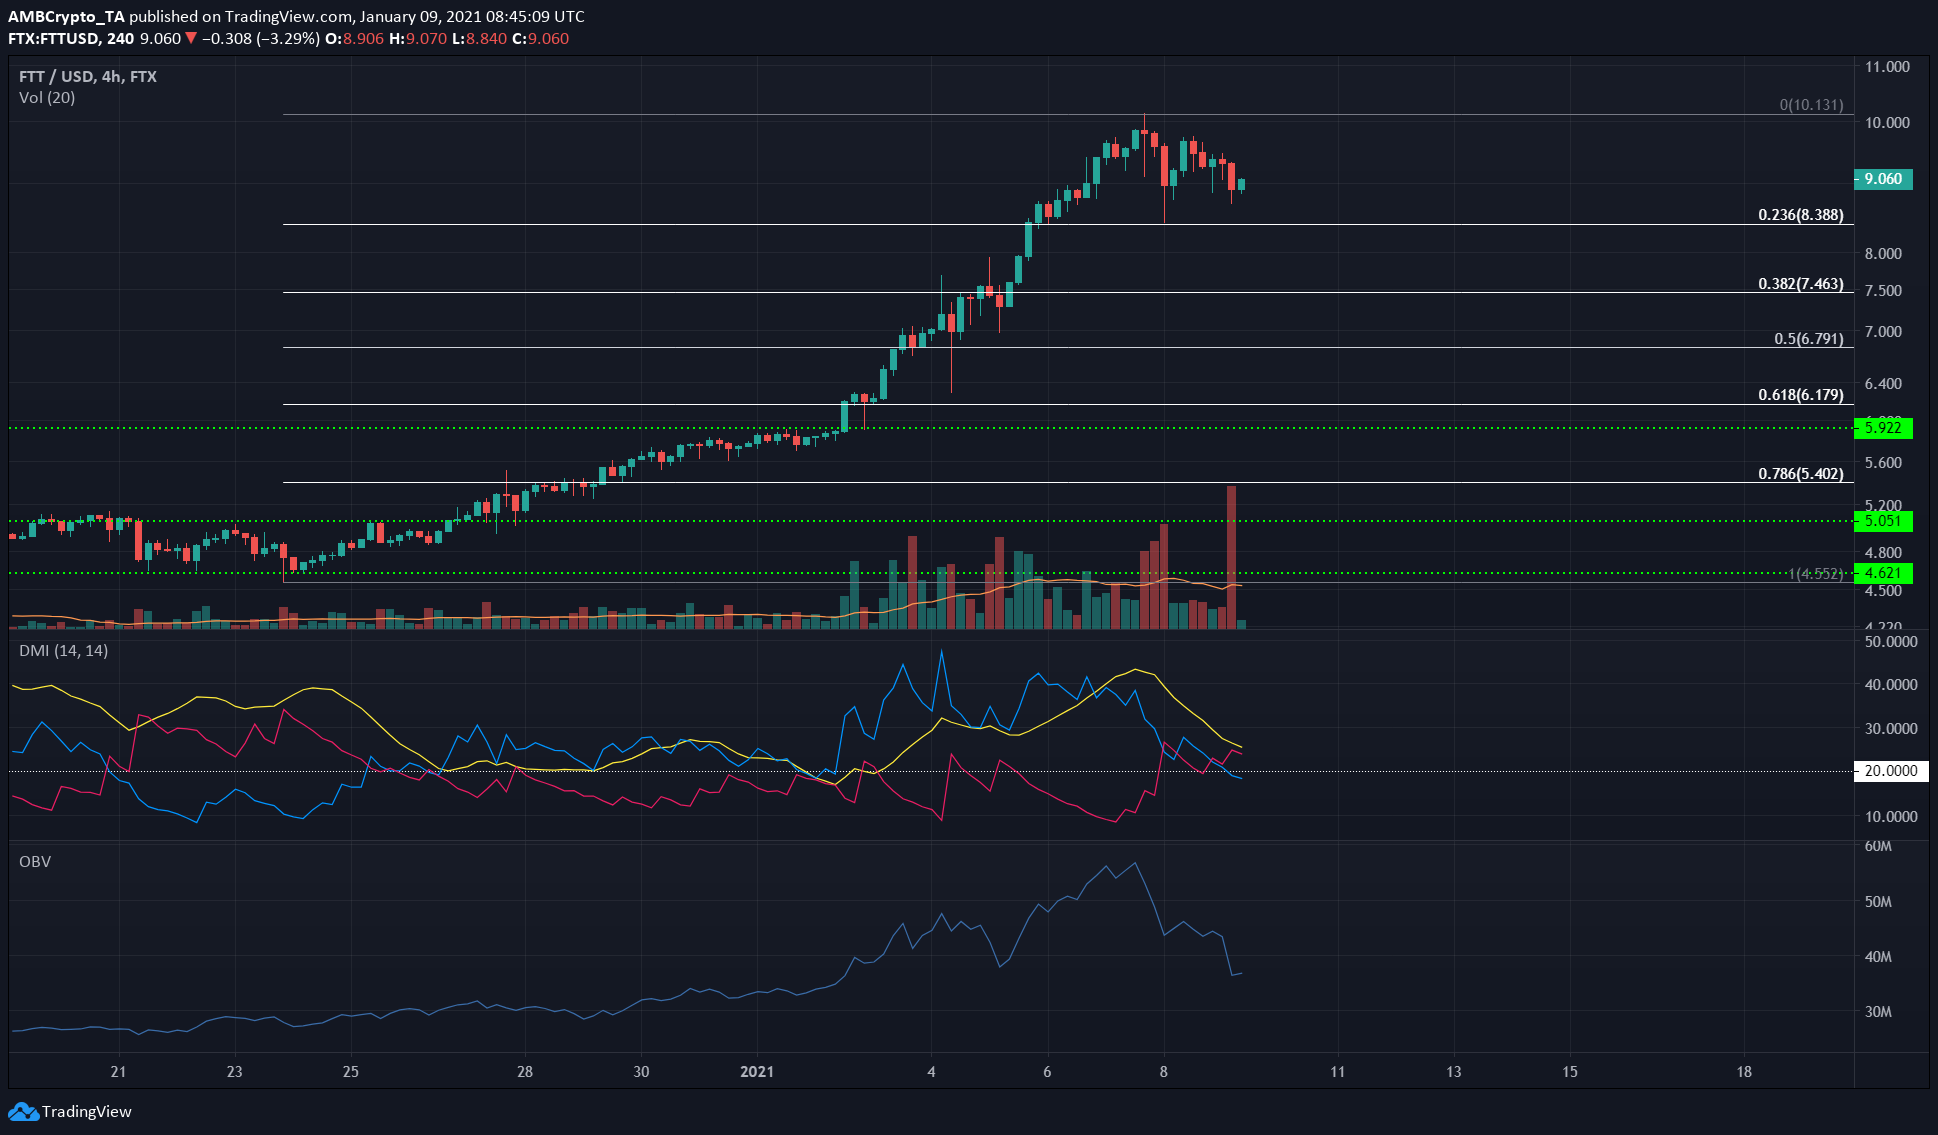
Since the breakout past $4 in late November and the subsequent retest of the same level nearly a month ago, FTT has been in a strong uptrend.
The 4-hour chart showed that that trend’s strength could have flipped, as the -DMI (pink) rose above the +DMI (blue) to indicate a bearish trend.
The OBV also formed a lower low, which was not an encouraging sign for FTT in the shorter timeframes.
Using the Fibonacci retracement tool for FTT’s move from swing low at $4.55 to swing high at $10.13, some important levels of support were highlighted.


