Cardano, Elrond, Neo Price Analysis: 10 February

Cardano saw a golden cross as its 4-hour 20 SMA moved above the 50-200 SMA while continuing the up-channel oscillation. On the other hand, Elrond and Neo saw solid ascending channel gains over the past two weeks but now formed a bearish divergence with its RSI as they braced for a near-term setback.
Cardano (ADA)
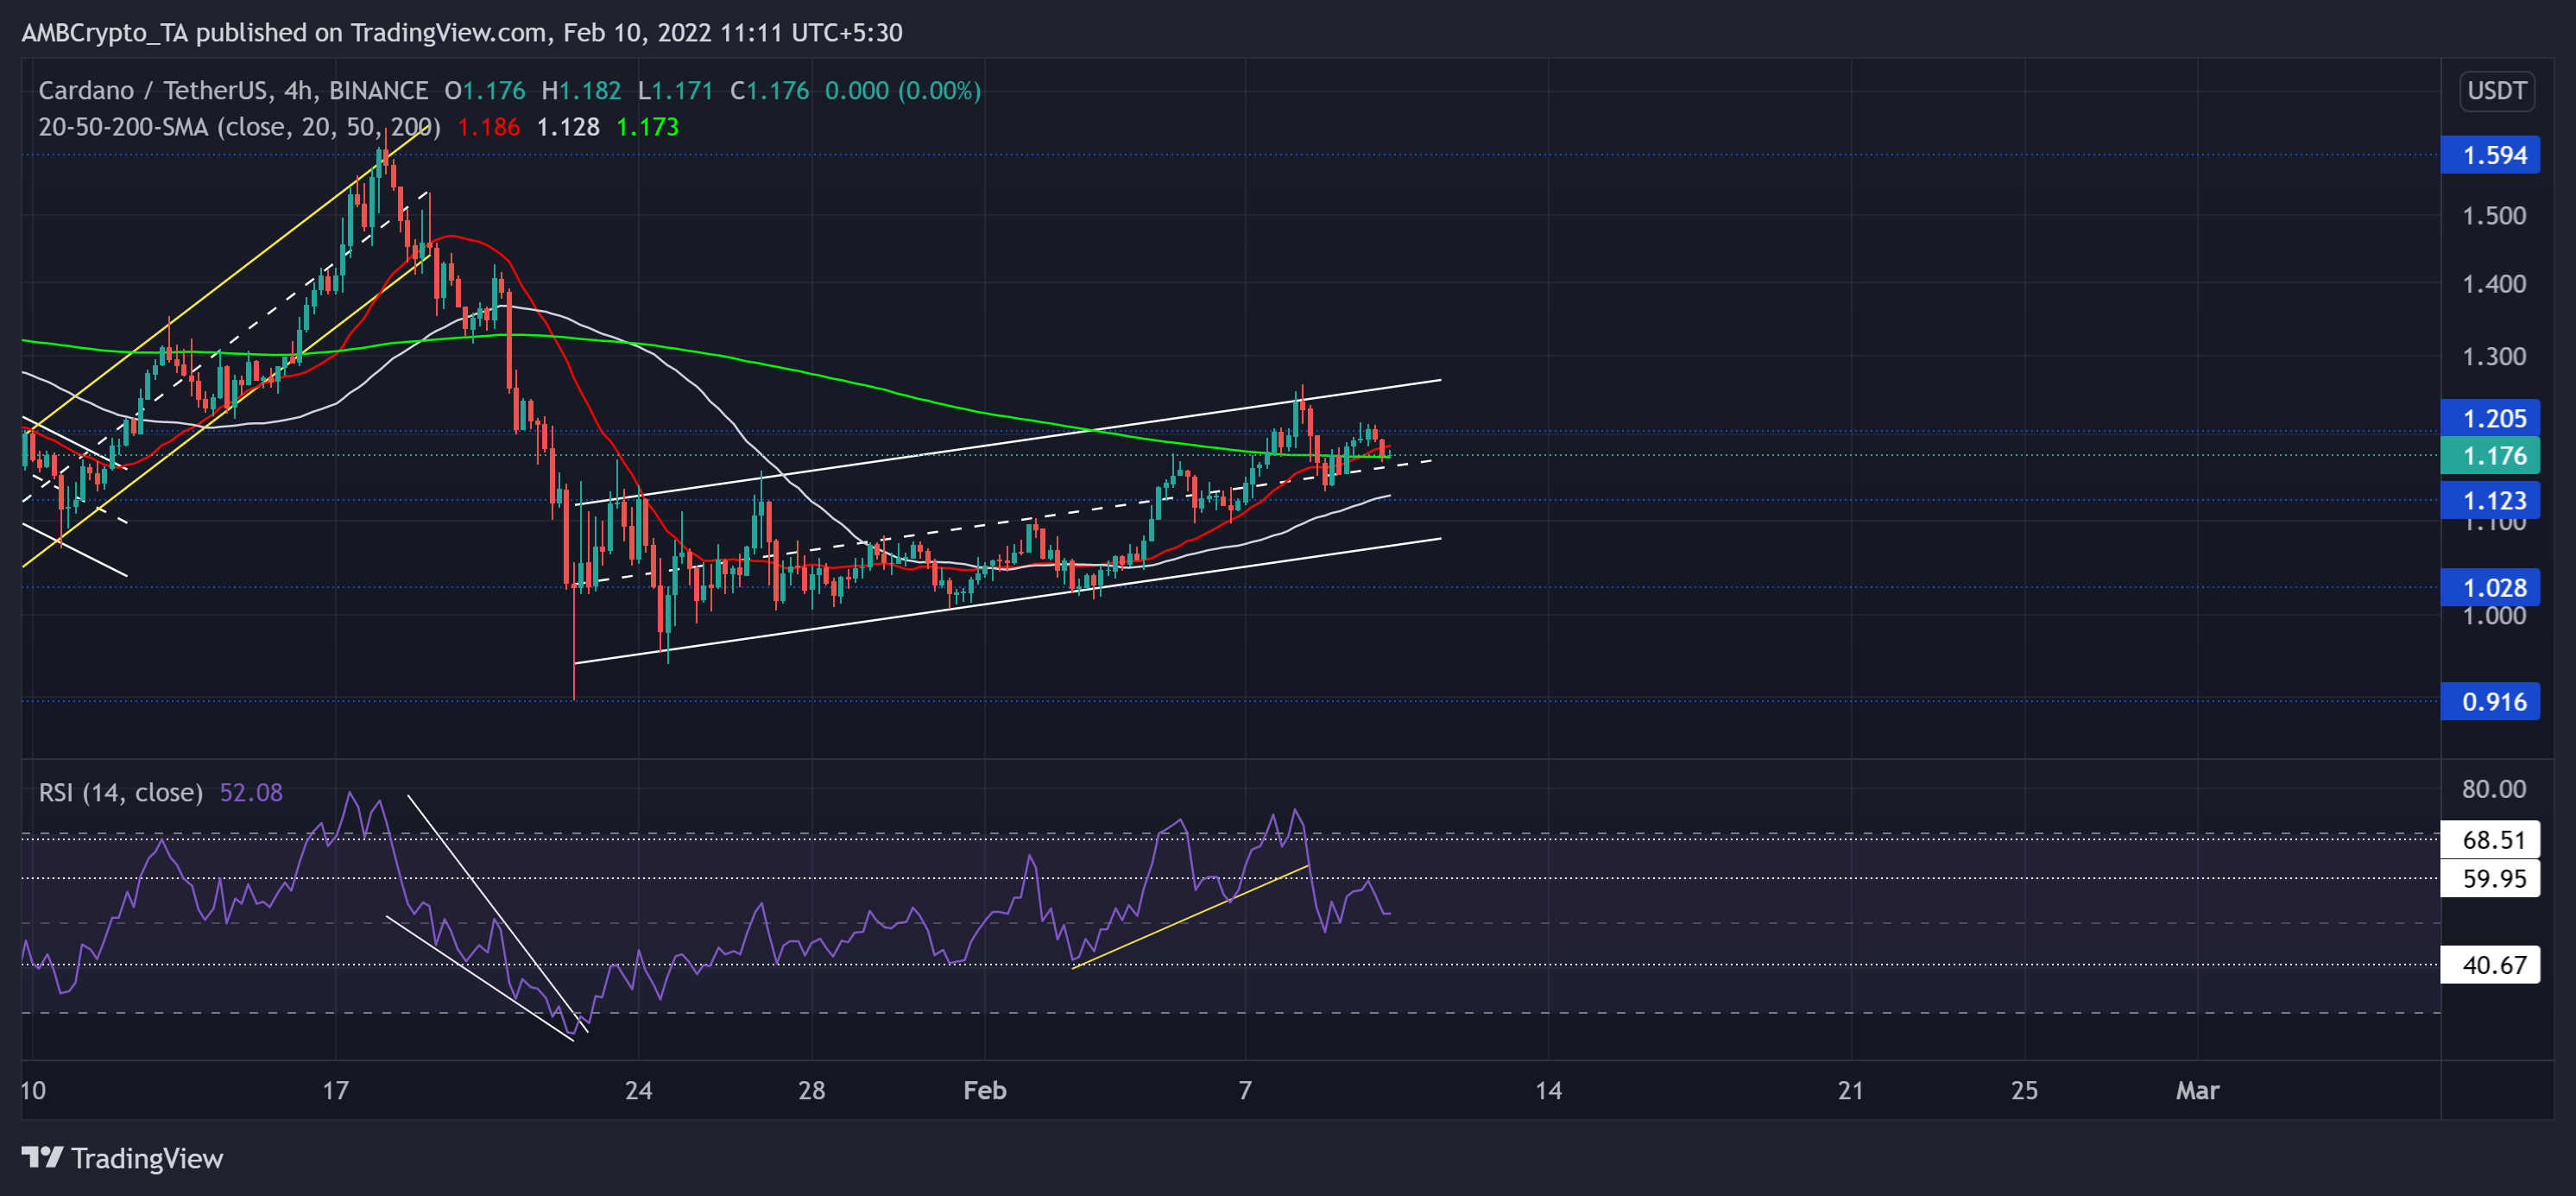
The alt fell by 44.2% (from 18 January) and poked its nine-month low on 22 January. However, ADA saw a 32.2% recovery as it pierced through the $1.12, $1.2-mark. Since then, the half-line of the up-channel (white, dashed) has assumed strong support.
It is vital to note that the 20 SMA (red) jumped above the 50/200 SMA on 9 February, affirming a bullish edge. Now, the immediate resistance stood near $1.2, followed by the upper trendline of the up-channel (white).
At press time, ADA traded at $1.176. Over the past two days, it saw a substantial decrease in buying pressure as the RSI drifted from the overbought region toward the half-line. But the bulls seemed to uphold the midline support. Any close below this level would propel a fall toward the $1.12-level.
Elrond (EGLD)
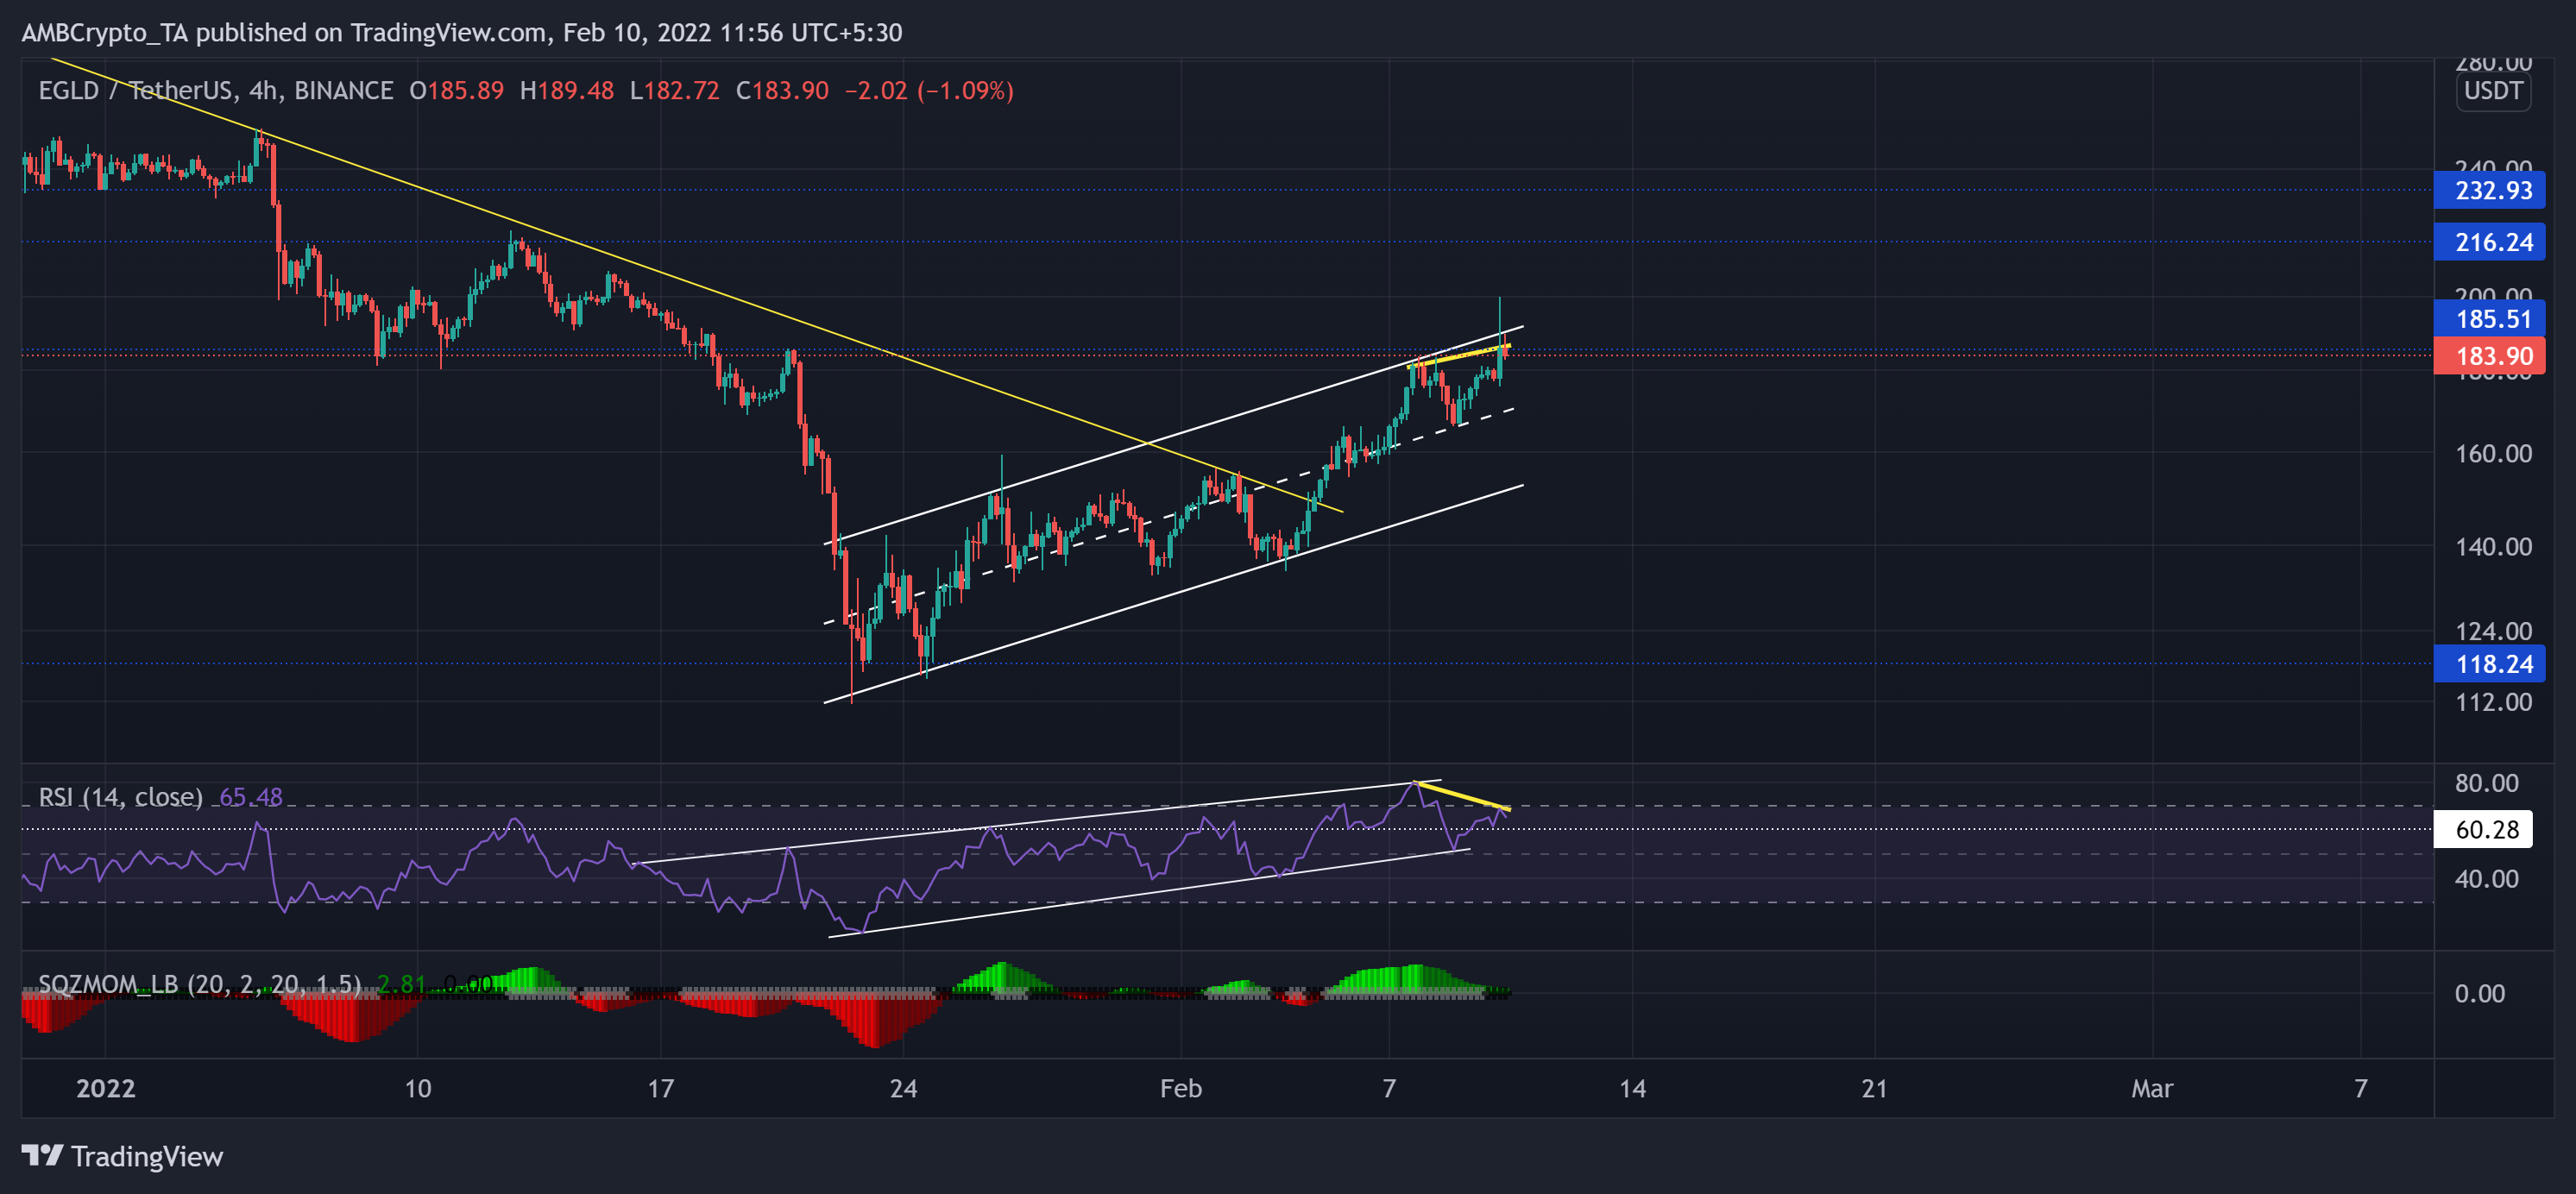
Since striking its ATH on 23 November near the $544-mark, EGLD steeply declined, as evidenced by the bearish trendline (yellow) on its 4-hour chart.
After the recent sell-off, the bulls stepped in at the $118.2-mark and upheld the six-month-long support. As a result, the recovery phase saw an impressive 76.9% rally (from its five-month low on 22 January) that poked above the $185-mark. During this phase, it also breached its 11-week trendline (previous resistance, yellow).
At press time, ELGD was trading at $183.9. The RSI correlated the price action while heading into the overbought region on 7 February. Since then, it formed a bearish divergence (yellow) with price as it headed to test the 60-mark support. Besides, the Squeeze Momentum Indicator now flashed black dots, hinting at a low volatility phase.
NEO
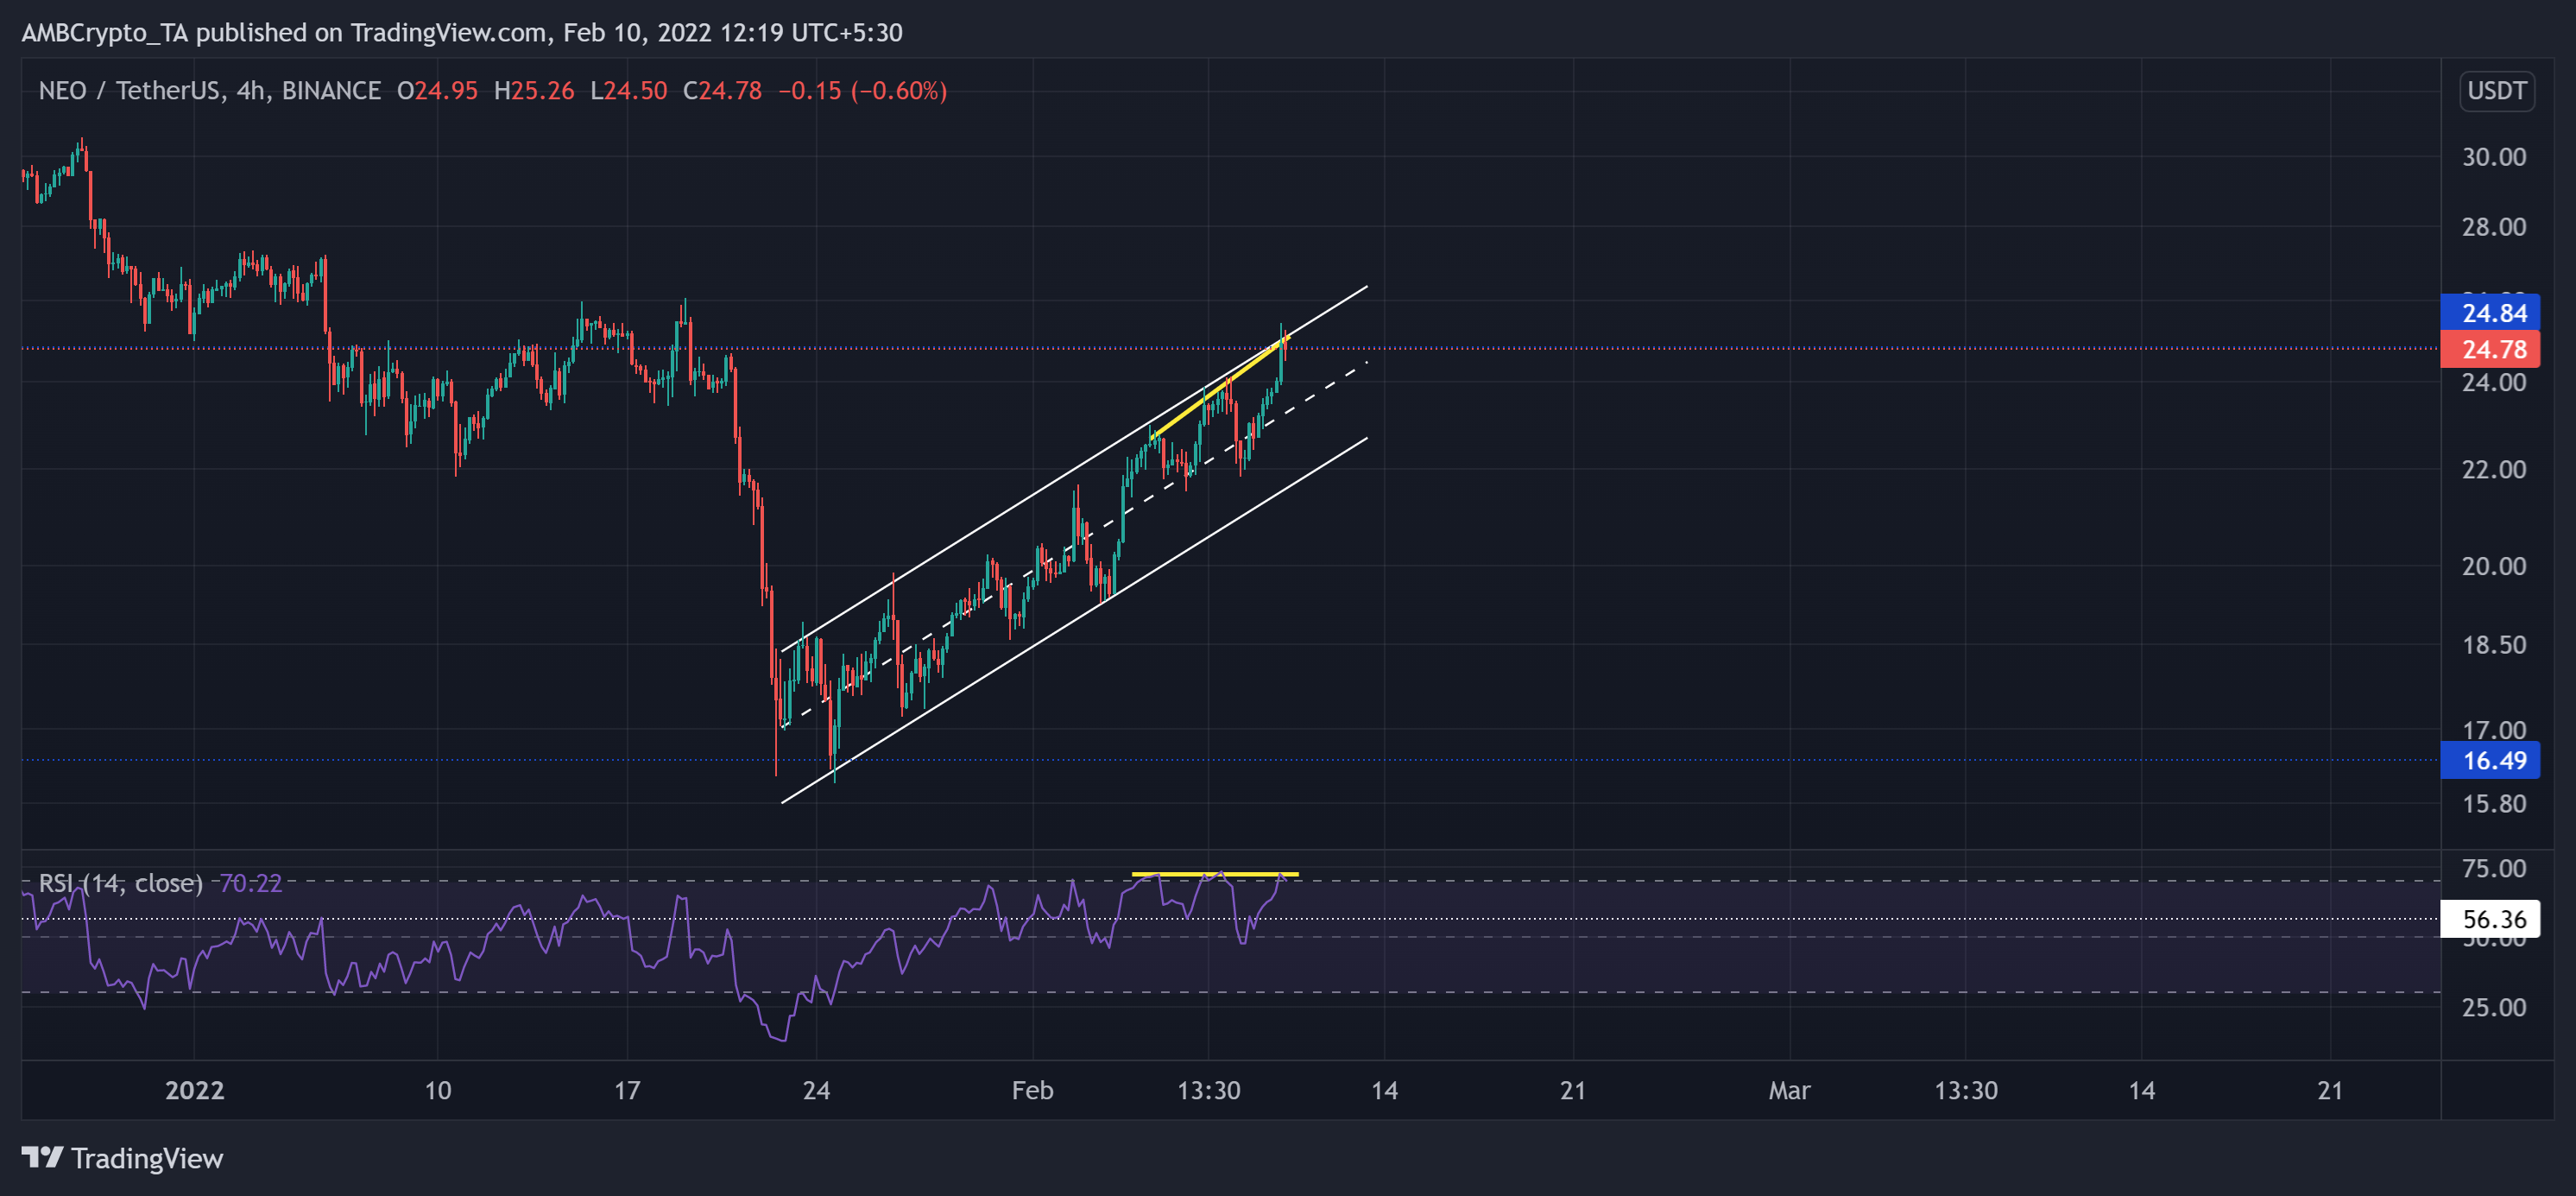
After poking its 3-month high on 6 September, NEO has witnessed multiple sell-offs while losing crucial price points. The most recent sell-off noted a 37% retracement (from 19 January) as the alt hit its one-year low on 24 January.
While the bulls defended the $16.4-level, NEO registered a nearly 58% ROI since then as it challenged the $24-mark resistance. The immediate support stood near the midline of the up-channel.
At press time, NEO traded 87.5% below its ATH at $24.78. The RSI stood in the overbought territory while forming a bearish divergence with the price. A reversal from this level to test the 56-mark would be likely.