GALA could be forced to move in this direction going forward
Disclaimer: The findings of the following analysis are the sole opinions of the writer and should not be considered investment advice
Gala has performed extremely well across the markets over the past week. It found some support around the $0.181-level and, in the past five days, has registered gains of close to a 100%.
This is a strong short-term bullish move, but can the bulls keep pushing higher? Bitcoin’s price direction in the next few days can also have a strong impact on GALA.
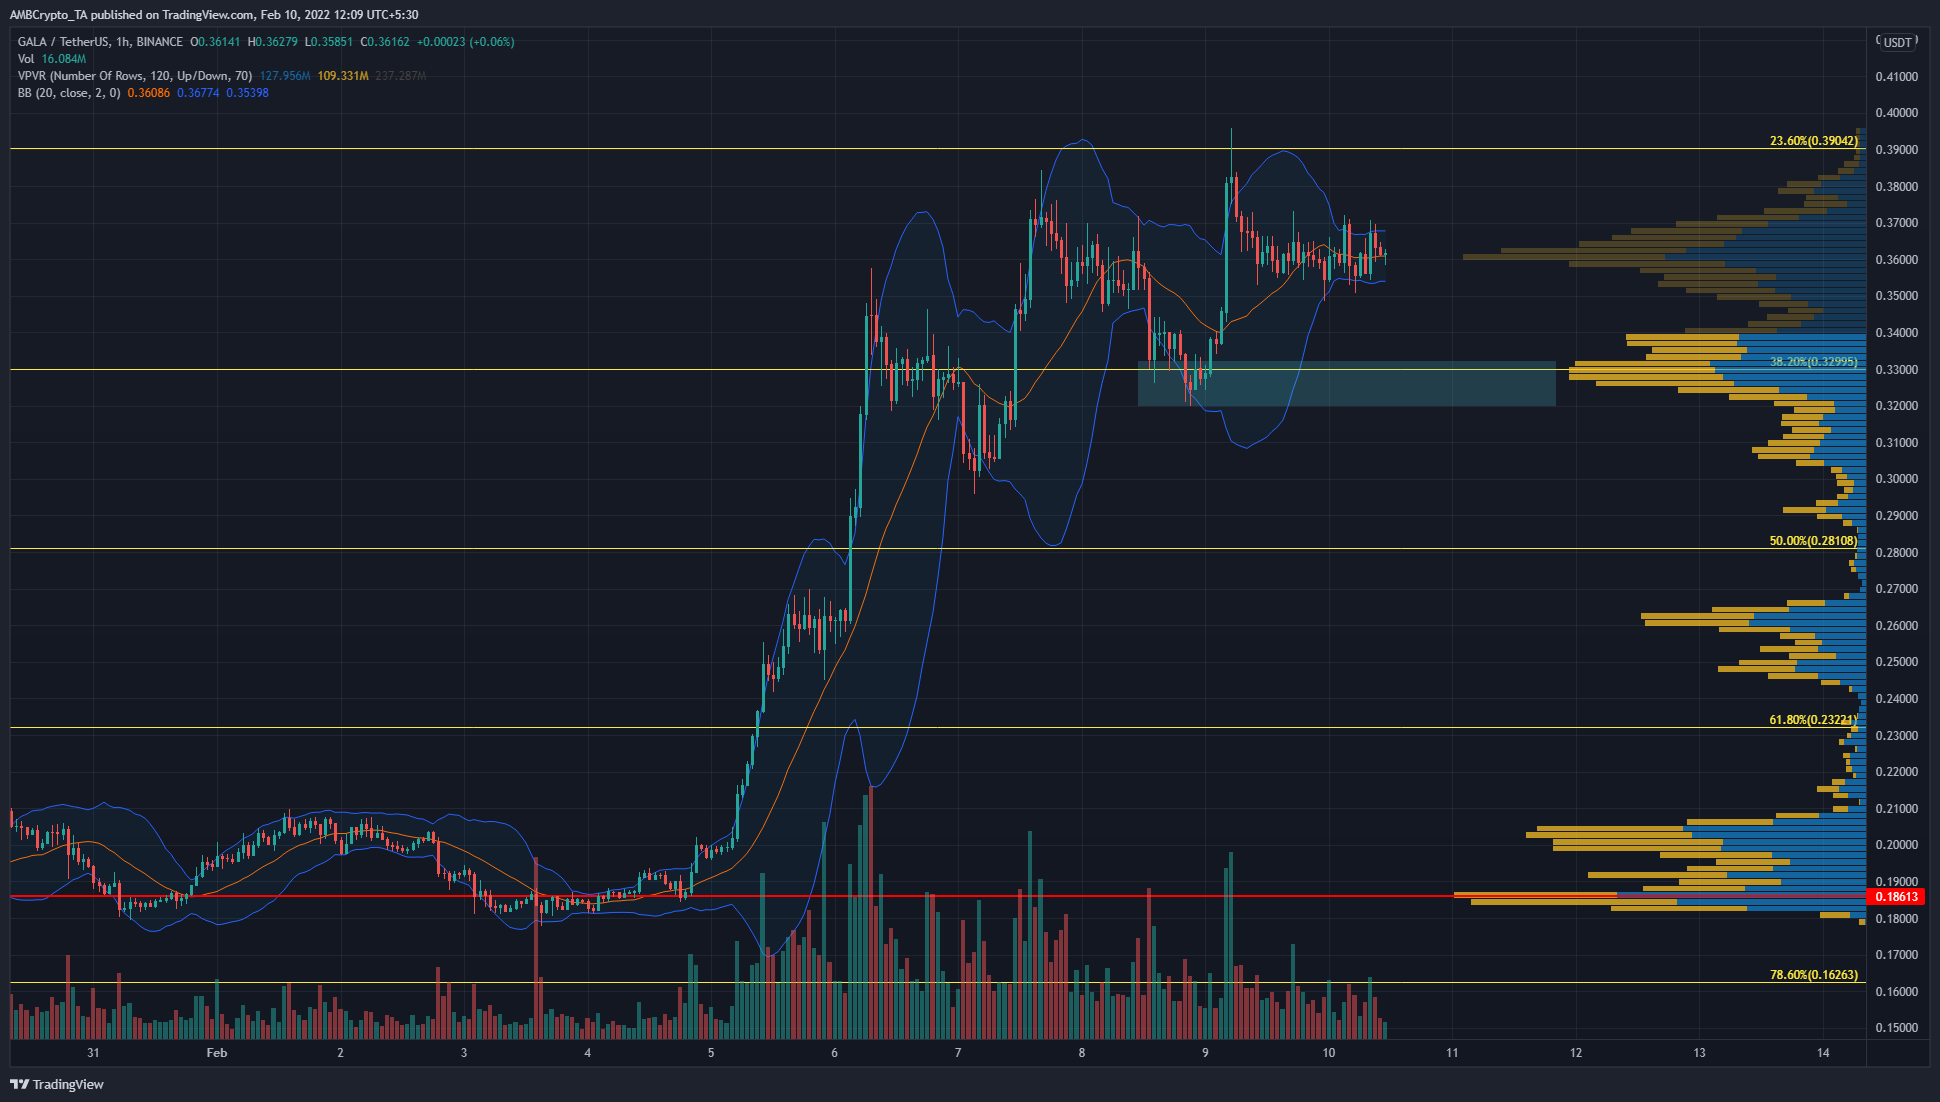
On the charts, the Fibonacci levels plotted (yellow) were from a previous move of GALA in November, when the price surged from $0.074 to $0.488. This move’s 27.2% and 61.8% extension levels at $0.6 and $0.74 were respected by GALA as resistance on the 1-day timeframe.
Moreover, the price also found support at $0.162, which was the 78.6% retracement of the aforementioned move.
When zooming in on the 1-hour chart to analyze GALA’s short-term strength, some divergence between the price and momentum was observed over the past couple of days. Alongside this bearish divergence, the Visible Range Volume Profile highlighted that the price’s most recent higher low at $0.32 was an area where demand could step in.
Beneath $0.32 is the $0.3-level where the price could see a bullish reaction.
Rationale
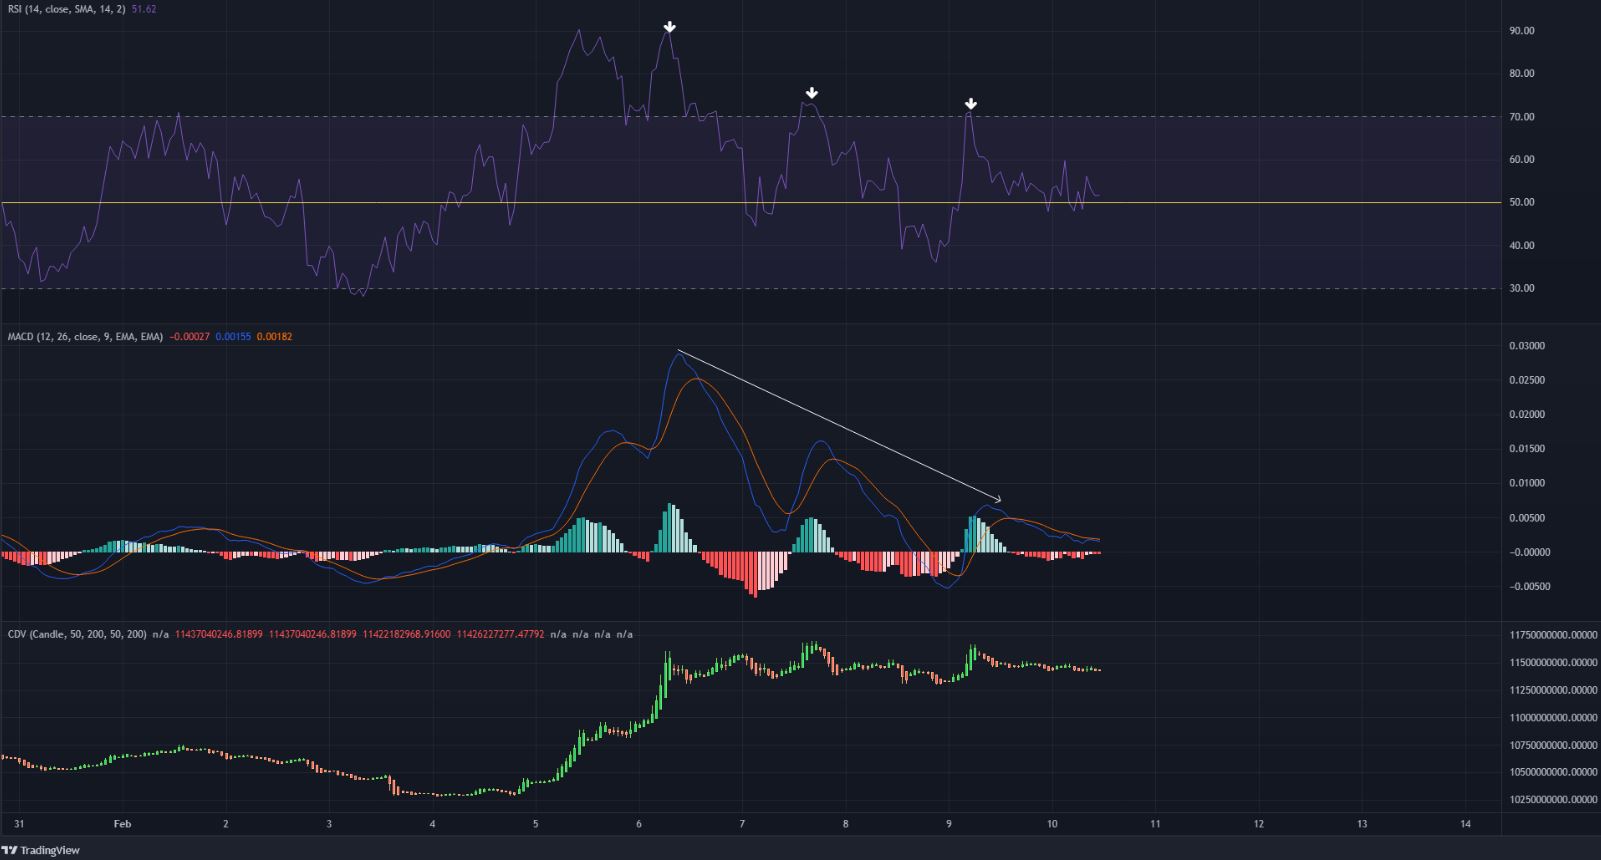
The RSI on the hourly chart has been forming a series of lower highs while the price pushed higher – An indication of weakening momentum. Similarly, the MACD also formed lower peaks. Both these popular momentum indicators underlined a bearish divergence on the lower timeframes, which could see a pullback for GALA.
The Bollinger Bands have been tight around the price over the past few hours prior to press time. This suggested that there could be an impulse move building strength. This move could be to the upside as well as downwards.
If a move to the downside occurs, the pullback might not be severe. This, because the Cumulative Delta Volume has seen significant gains in the past few days, highlighting strong demand. On a pullback, if it happens, selling pressure would have to be quite intense to force the CDV a notable distance south. In such a scenario, bidding at the $0.32 or $0.3-support levels could be precarious.
Conclusion
For GALA, its strong performance over the past few days is likely to attract buyers. Therefore the $0.36-$0.39 zone would be a good area for large players to take profit, force prices lower, force late longs to close, and suck in liquidity before the next leg upwards.
However, another slingshot higher is also a possibility, and a session close above the $0.39-level could be an aggressive entry for long positions in such a scenario.


