
Cardano maintained a bullish trajectory after a breakout above $1.48. Ethereum’s rise above $4,000 was hardly a surprise considering strong buying pressure prevalent in its market. Finally, Polkadot presented a sell signal at the current price but this would change if bulls flipped $42.2-$46.5 to support from resistance.
Cardano [ADA]
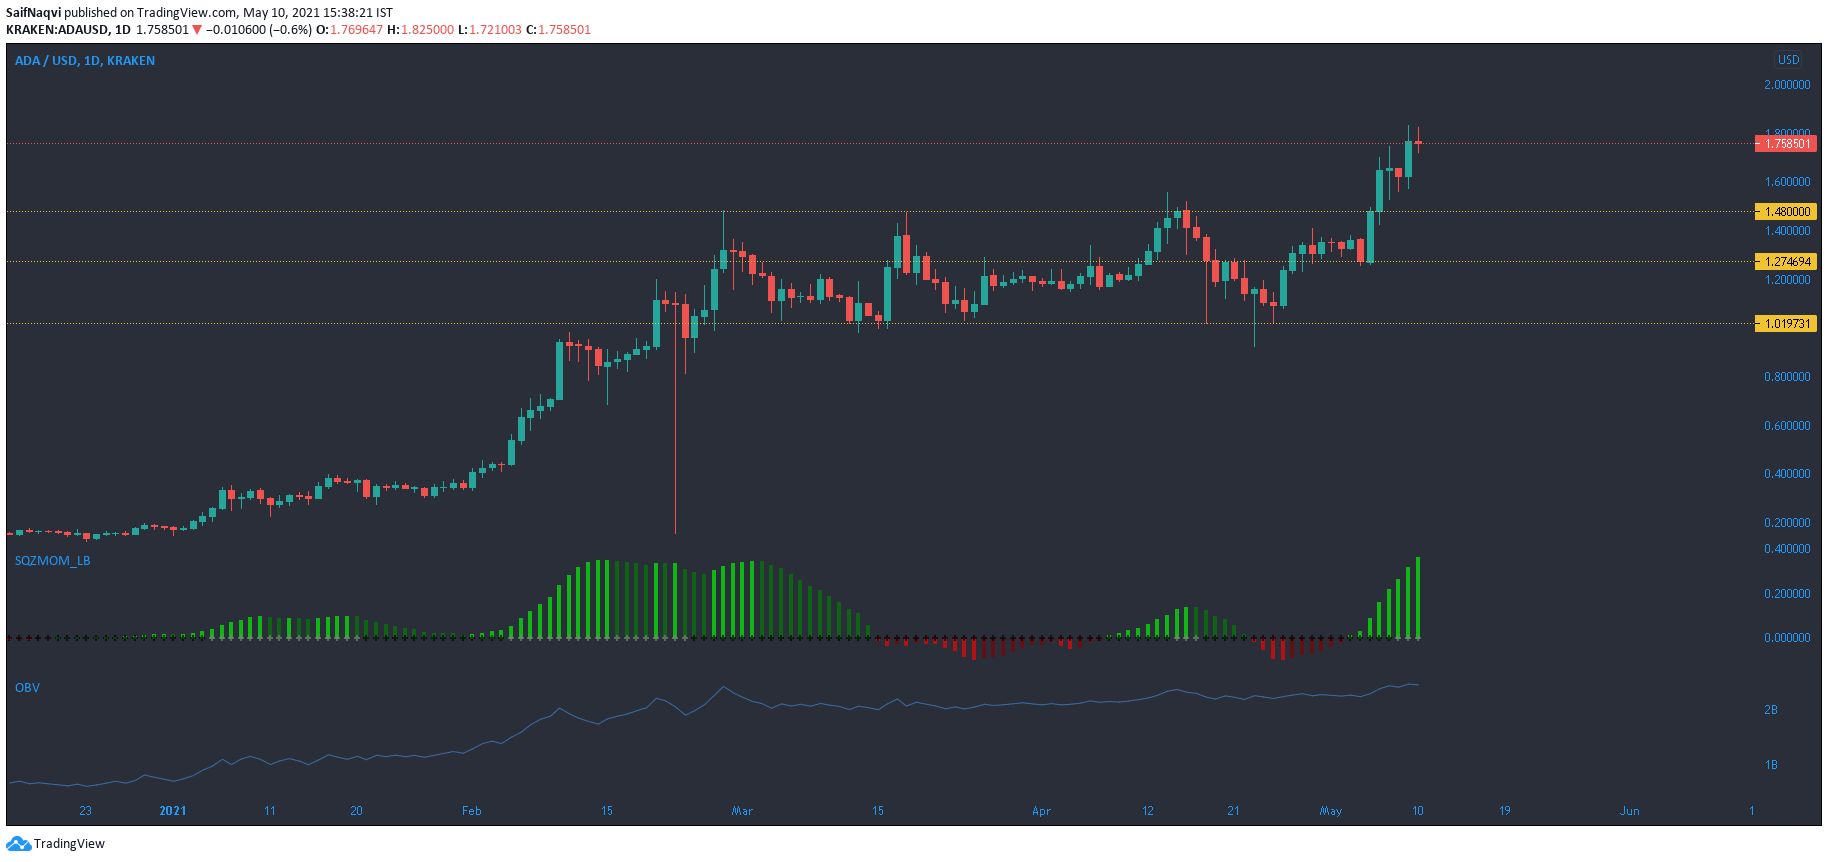
Source: ADA/USD, TradingView
Squeeze Momentum Indicator showed bullish momentum in the market as Cardano continued its northbound movement after a breakout above $1.48. Targets identified at $2.13 and $2.37 in a previous analysis were yet to be achieved but trading volumes were on the move. OBV has been on an uptrend since the onset of 2021 and buying pressure has been a constant driving force in the market.
With upgrades to its ecosystem lined up during May, ADA would likely see bullish price action throughout the rest of the month. For the moment, it was unclear what support lines would emerge in the event of a correction, but the recently breached $1.48 level could hold in case of a sell-off.
Ethereum [ETH]
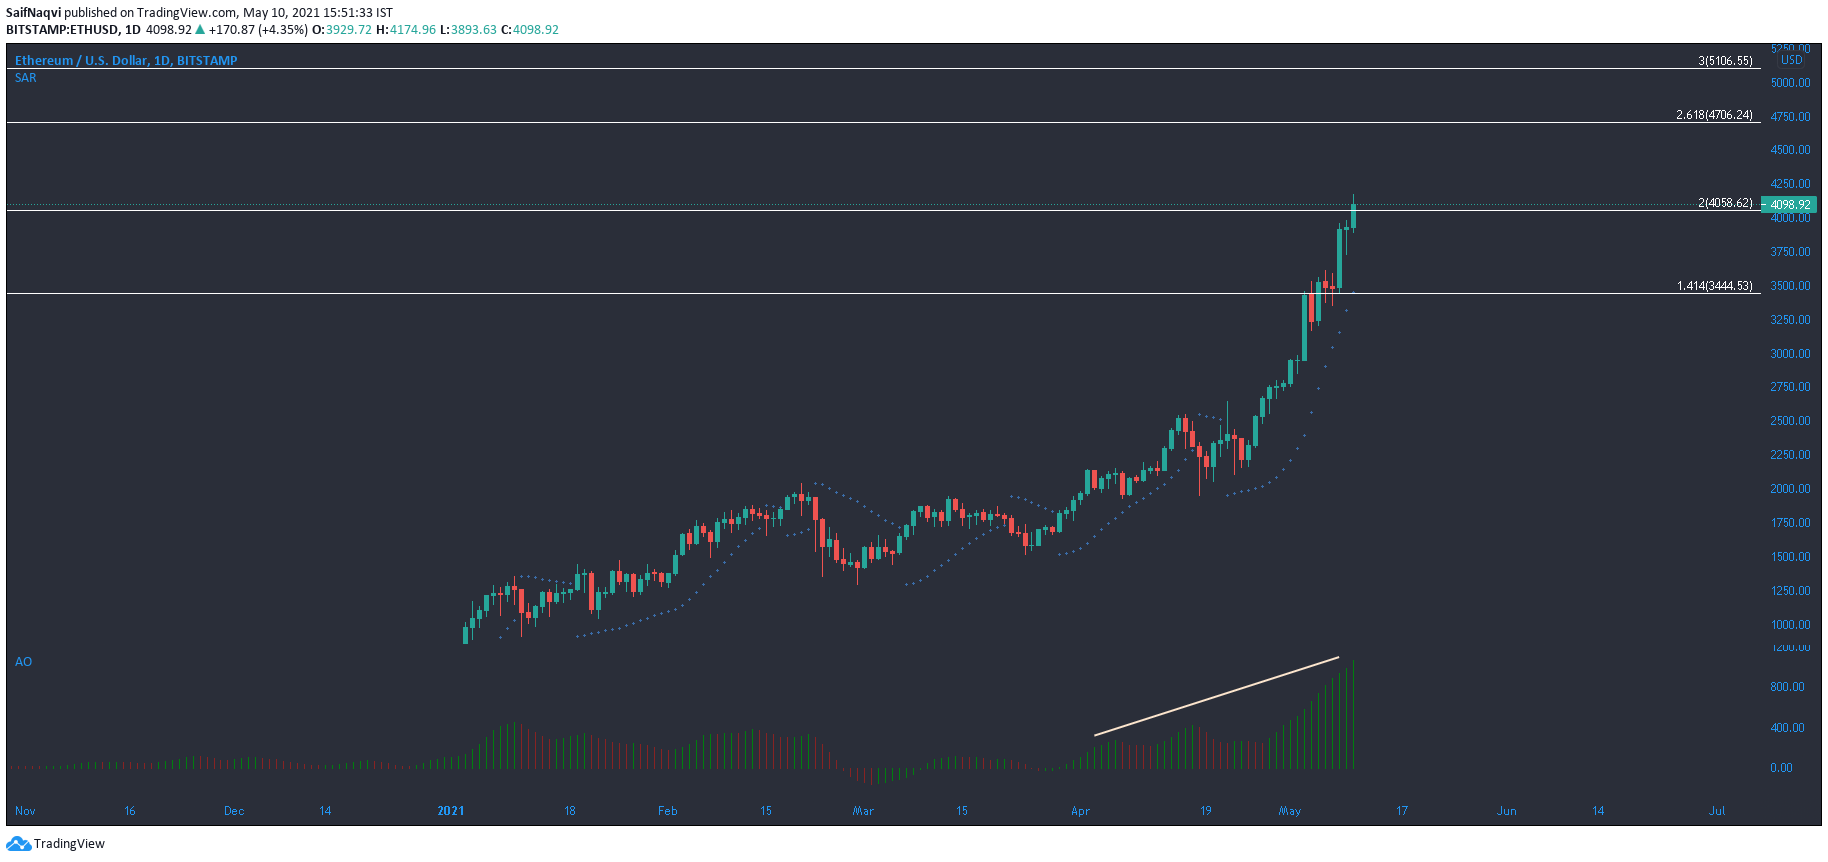
Source: ETH/USD, TradingView
Ethereum scaled above the $4,000-mark and a single candlewick even rose as high as $4,174 at the time of writing. Using ETH rally from $1,520 to $2,548 and a subsequent pullback, a few Fibonacci Extension Levels were plotted on the daily timeframe. The 261.8% ($4706.2) and 300% ($5,106) Fibonacci extension levels could be achieved during the current rally. Other areas pointed out on the chart could act as support lines when a pullback occurs.
A rising Awesome Oscillator underscored strong buying pressure in the market. The last time AO slipped into negative territory was back in late-March. The Parabolic SAR’s dotted markers have remained below the candlesticks since 21 April, highlighting ETH’s relentless uptrend.
Polkadot [DOT]

Source: DOT/USD, TradingView
Supertrend Indicator on Polkadot presented a sell signal as the price closed in on $42.2-upper ceiling. As mentioned earlier, DOT needed to scale two levels to see a lift-off. One was at $42.2, and the other at $46.5. A rise above the former level is also where Supertrend Indicator would flip to buy.
While MACD did trade above the half-line, its histogram noted declining green bars. A bearish spinning top of Doji candlestick could signal the end of a current rally and traders should be on the lookout for such a formation. If volumes and buying pressure are sustained over the next few days, expect a positive outcome. The first couple of targets for DOT lay at $53 and $57, as highlighted in the previous analysis.