Cardano, Filecoin, Dogecoin Price Analysis: 14 May

Cardano could see a minor dip before climbing above the $2-mark. Filecoin broke south from a descending triangle and registered losses of 9% from the bottom trendline. Finally, Dogecoin would present a stronger buy signal above its $0.569-resistance.
Cardano [ADA]

Source: ADA/USD, TradingView
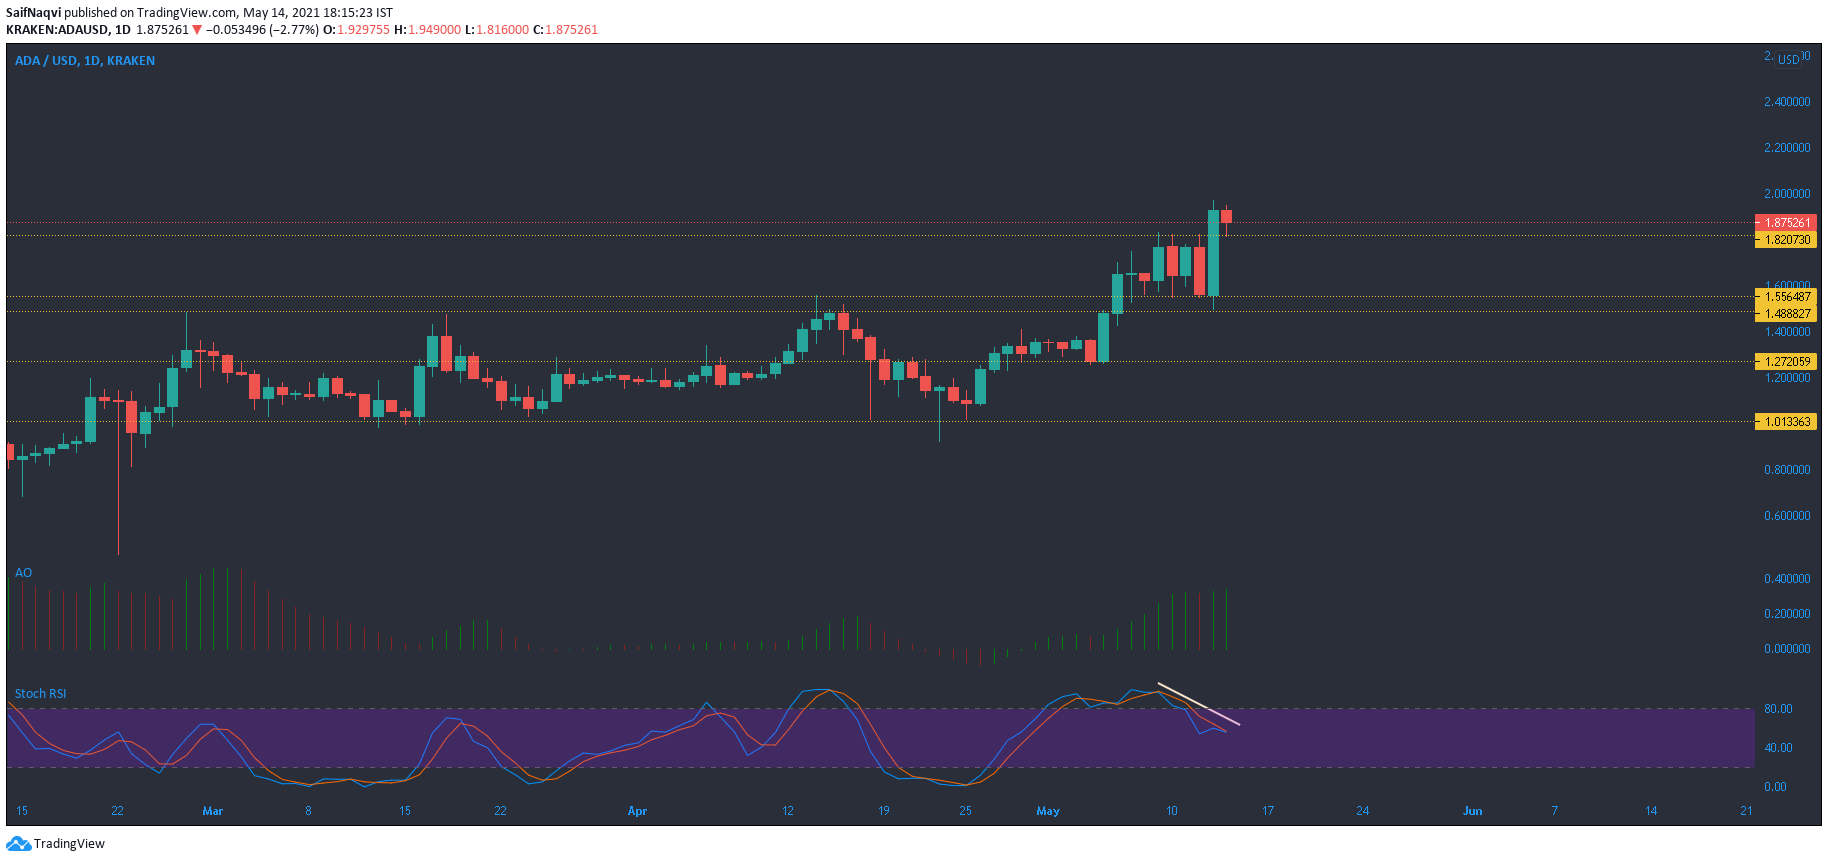
While the broader market pullback did diminish weekly gains for most alts, Cardano was somewhat of an exception. In fact, Cardano was one of the few alts in the top 20 that maintained positive weekly returns. If Ethereum consolidates around the $4K-region, ADA would have likely overcome the correctional phase in the broader market with only a few hiccups. This would see ADA maintain its northbound movement over the coming days. On the daily chart, ADA was supported by $1.55 and yesterday’s close saw the price rise to a high of $1.97.
The Awesome Oscillator showed that buying pressure has been on the up since the start of May. However, the RSI formed lower highs and indicated some weakness as the price approached the $2-mark. In case of minor pullbacks, a couple of support levels resided at $1.55 and $1.48.
Filecoin [FIL]

Source: FIL/USD, TradingView
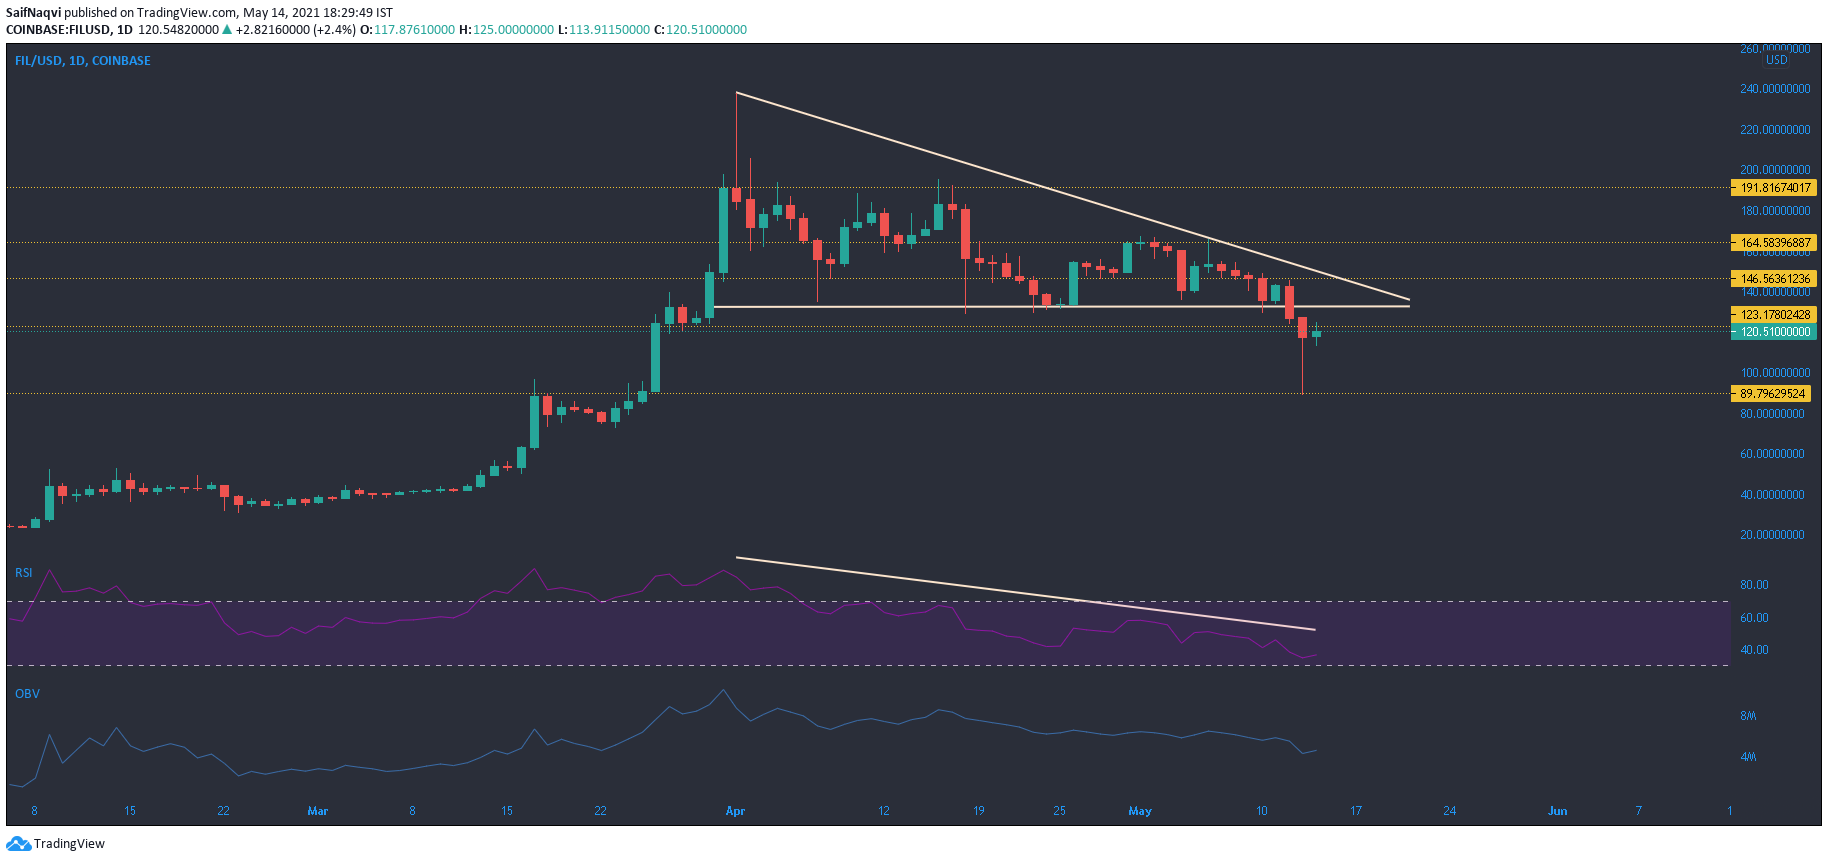
A descending triangle breakdown on Filecoin saw losses of over 9% from the bottom trendline, although a single candlewick dropped as low as $81.61. With selling pressure still prevalent in the market, it would be doubtful whether the bulls could reclaim the region above $133.2. Lower highs on the RSI highlighted a weakening trend after FIL’s strong rally from February to March. If the RSI does break above its upper trendline, a bullish comeback could be on the cards.
Such was also the case with the OBV which noted rising selling pressure over the past two weeks. For a bullish comeback, the resistance levels at $46.5 and $164.5 need to be overcome.
Dogecoin [DOGE]

Source: DOGE/USD, TradingView
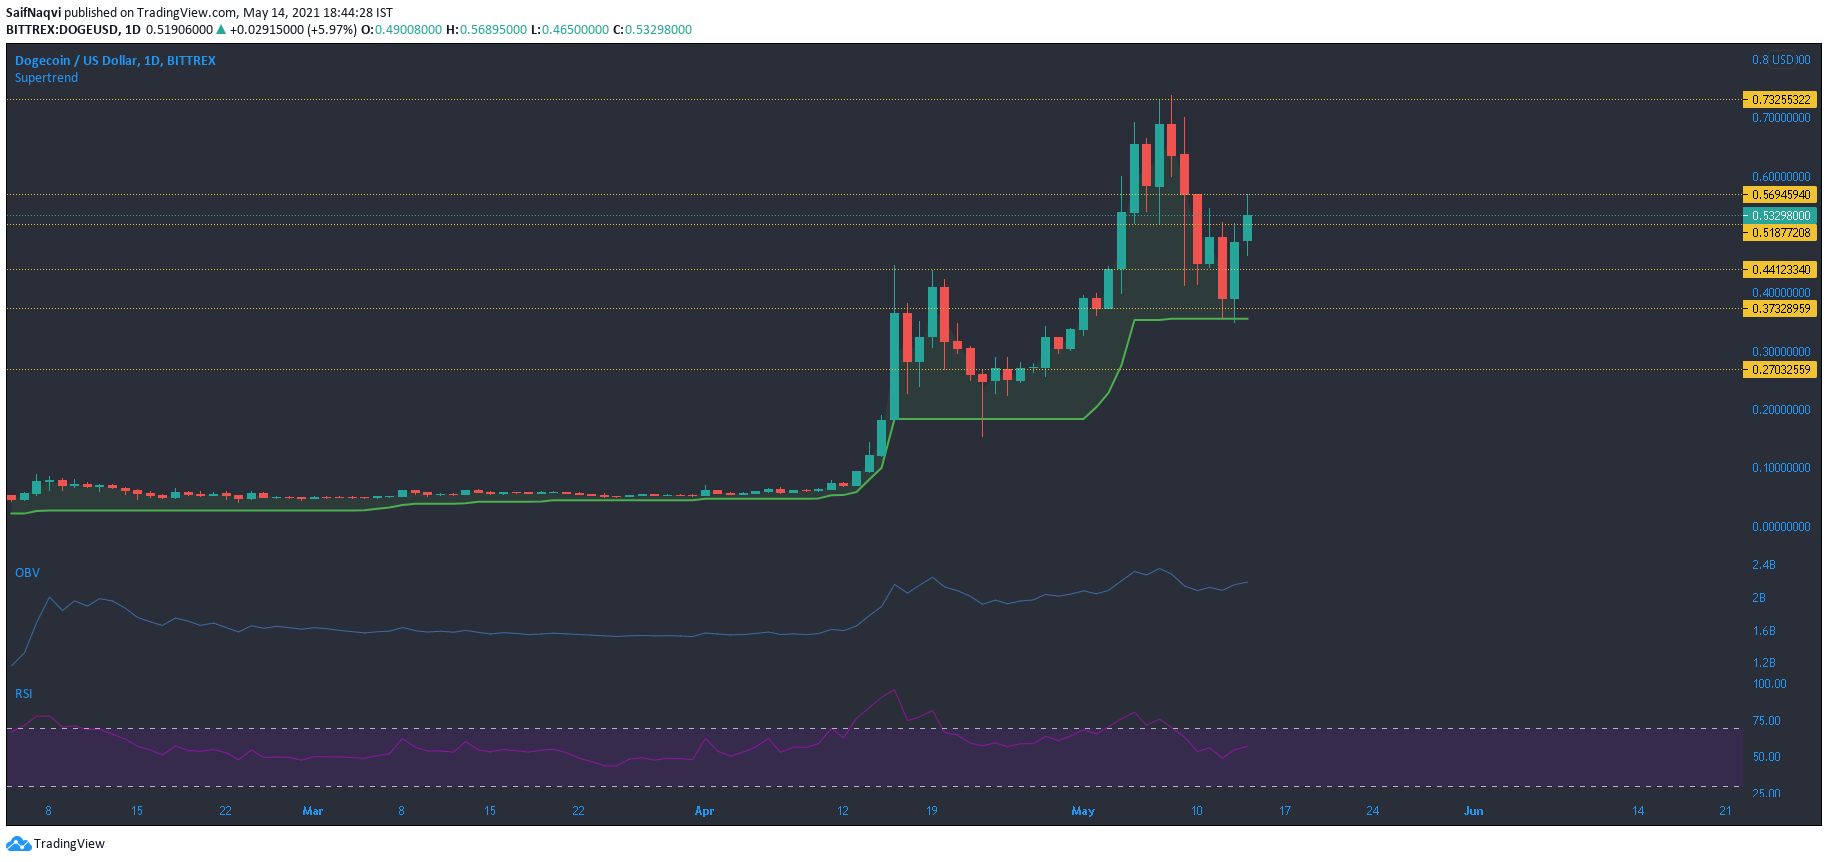
Post the SNL sell-off, Dogecoin saw a re-emergence of buying pressure in the market at the $0.373-support – a region that coincided with the 200-SMA on the 4-hour timeframe. Now above the 20-SMA on its daily chart, is it the right time to buy DOGE again?
The SuperTrend Indicator did present a buy signal at the press time price with a stop loss set at $0.355. On the 4-hour timeframe, a few candlesticks closed above a crucial resistance level at $0.51. With the 24-hour trading volumes up by nearly 60%, it was likely that DOGE would see more gains over the coming hours.
The next resistance level lay around $0.569 and buyers can wait for a rise above this level to safely re-enter the market. The RSI headed back above 60 after DOGE stabilized from the overbought region.


