Cardano, Filecoin, Tron Price Analysis: 01 June

Cardano was expected to defend the $1.58 area in case of bearish pressure. Filecoin was likely to resume its consolidation between $55-65 before a price swing. Finally, Tron traded within a symmetrical and eyed a breakout above its upper trendline.
Cardano [ADA]
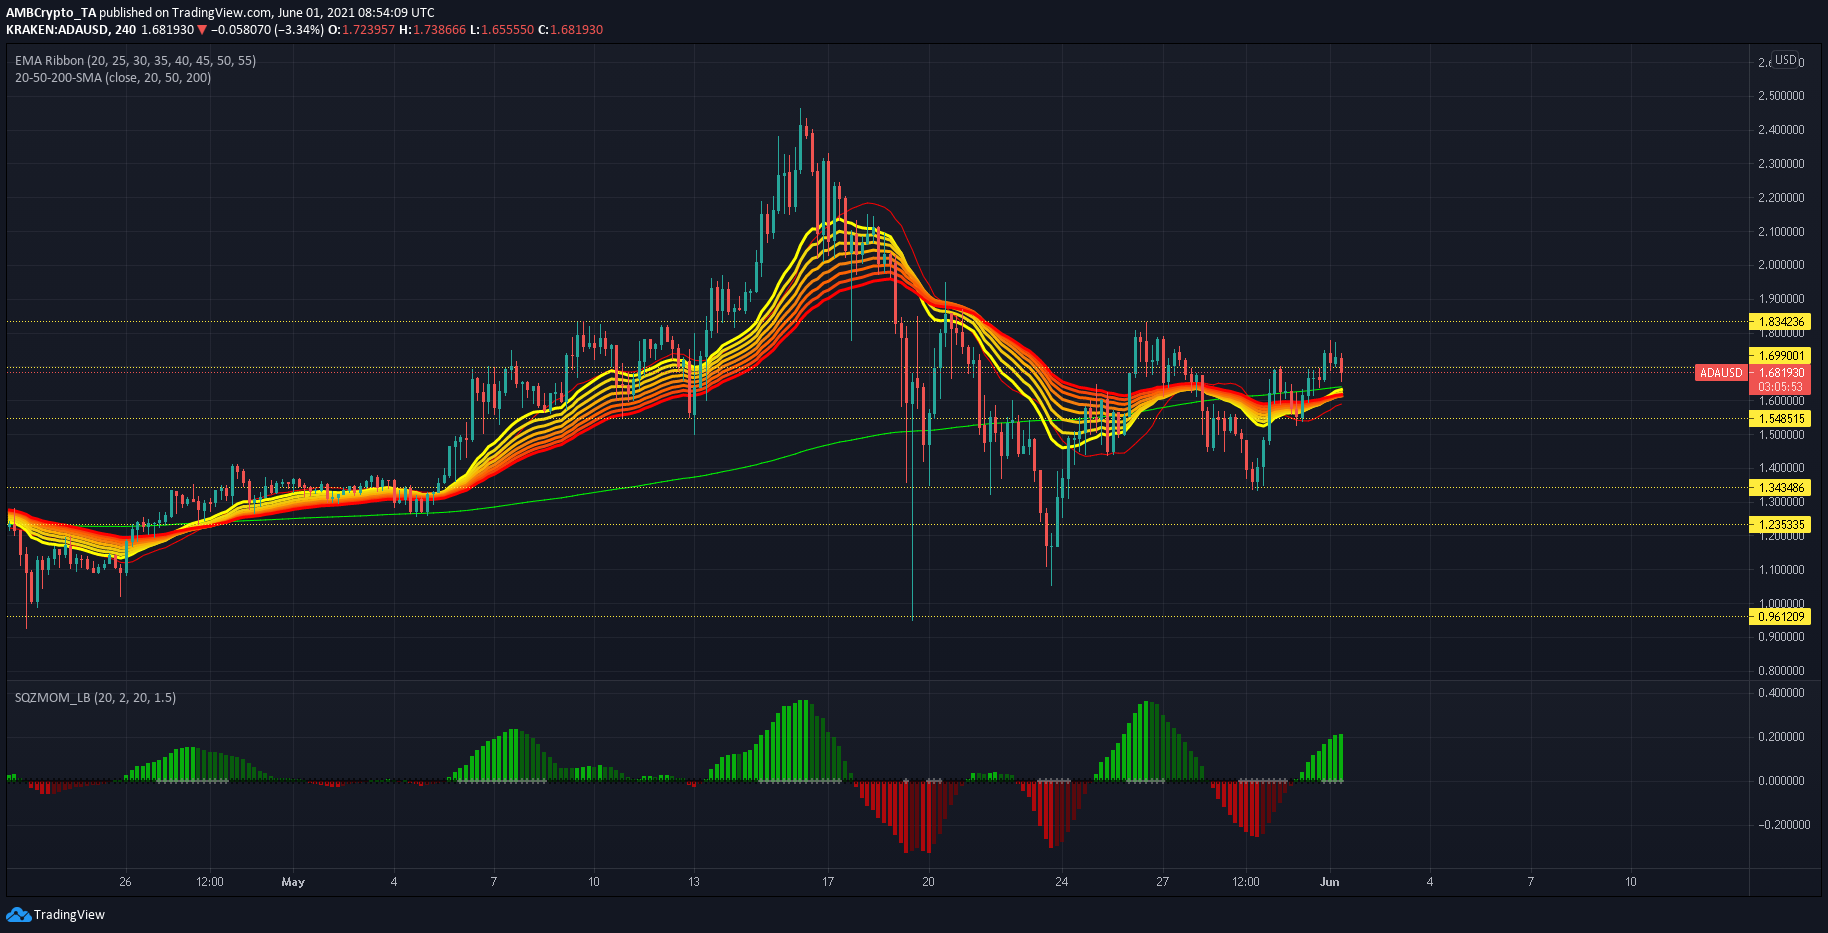
The 4-hour chart better captured Cardano’s dip even though the cryptocurrency was up by 5% over the last 24 hours. The chart showed a bounce back from support lines at $1.34 and $1.58 but ADA was unable to break above $1.83. This led to some downwards movement as ADA headed back towards its defensive line at $1.58. Interestingly, this support mark showed a confluence between the 20-SMA (red) and 200-SMA (green). EMA Ribbons could also provide an extra layer of defense against a breakdown.
Consolidation lay ahead for ADA considering the contracted nature of the EMA Ribbons. However, if these bands cross over, a bullish trend can be expected. According to Squeeze Momentum Indicator, buying pressure was still prevalent for a price swing. Conversely, a breakdown would highlight $1.34 support.
Filecoin [FIL]

The 12-hour chart was used to analyze Filecoin’s trend prior to the crypto sell-off and the aftermath of the event on its price. Lower highs since April 1 indicated weakening in the market and ceding $132-123 support triggered a breakdown from a descending triangle. While FIL did seem to find support around $94, the recent crypto bloodbath accentuated its losses and dragged it towards $55-65. Since then, FIL has struggled to post gains and has largely oscillated between $77.3 and $65.
With bullish momentum building up on the Awesome Oscillator, further breakdowns were unlikely. In case of a breakout, levels to look out for include $94 and $110. However, RSI was still below 40 and needed to rise to flip bear market conditions.
Tron [TRX]
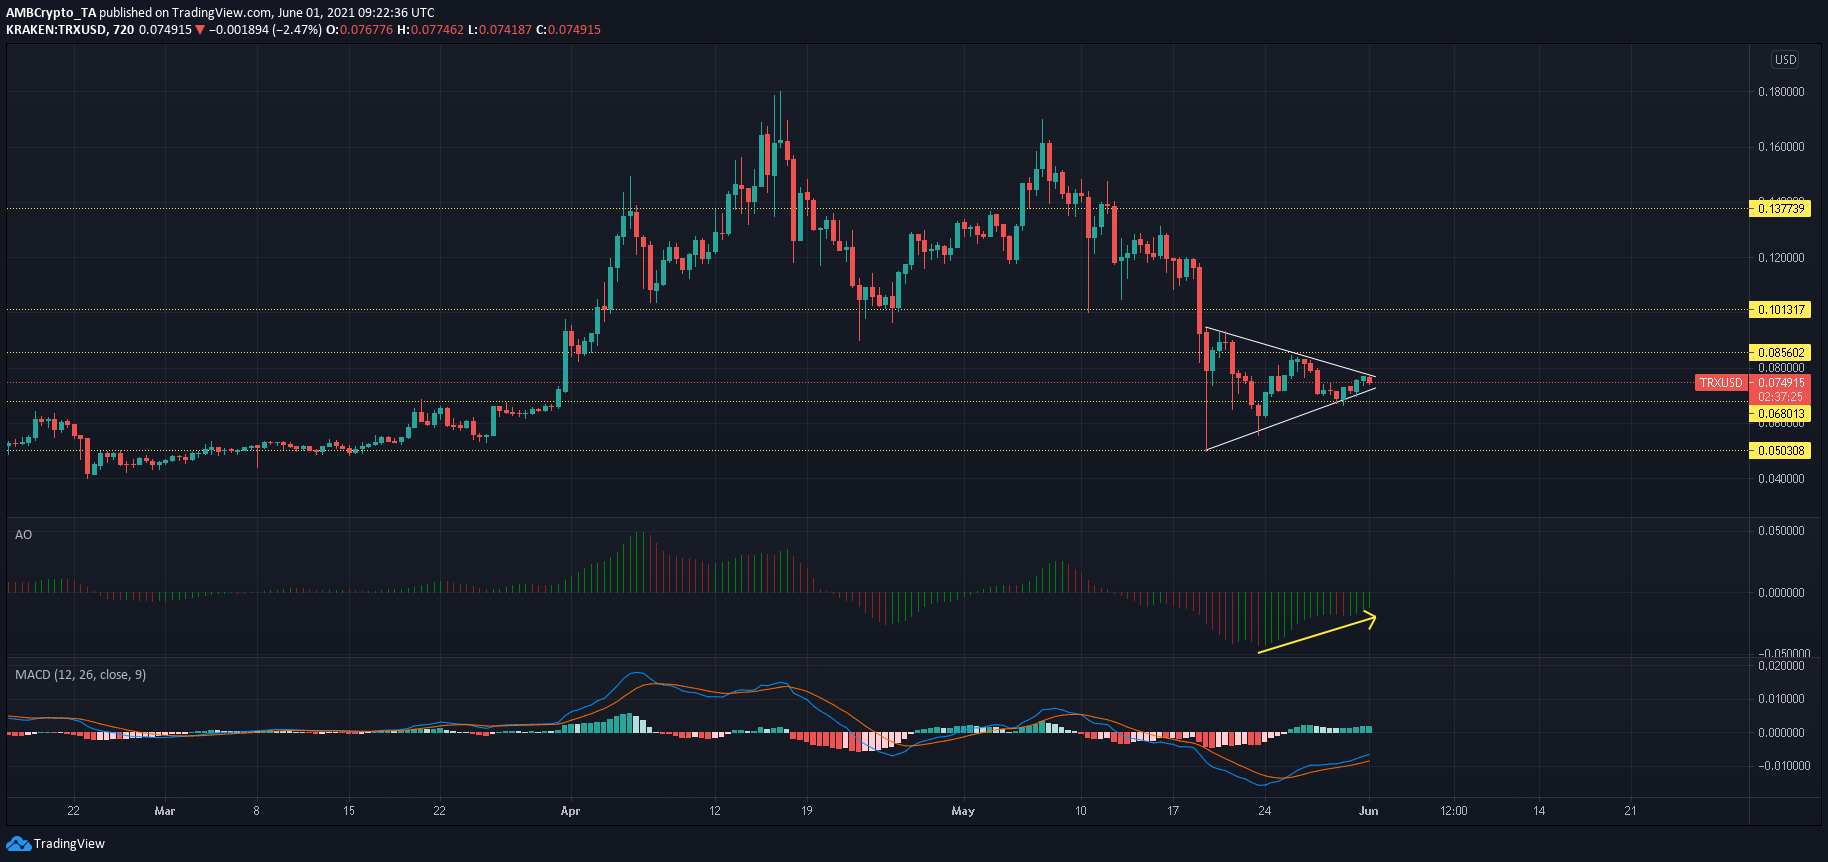
Tron formed a symmetrical triangle on the 12-hour chart and a breakout was expected over the coming days. A rise above the upper trendline could trigger a rally for TRX but a resistance zone lay between $0.08-0.101 and gains could be limited within this channel. A bearish scenario could drag TRX between $0.058 and $0.062. A bullish twin peak setup on Awesome Oscillator suggested an increase in buying pressure moving forward.
MACD also underlined some bullish conditions as the fast-moving line was above the signal line. On the other hand, consolidation between $0.058 and $0.680 would likely negate the symmetrical triangle.