Cardano, IOTA, Dogecoin Price Analysis: 01 March
Cardano shrugged off a minor correction and eyed record levels once again. IOTA was unlikely to breach above its overhead resistance even though the indicators tipped slightly in favor of the bulls. Dogecoin formed a symmetrical triangle but a breakout in either direction depends on cues from the larger crypto market.
Cardano [ADA]

Cardano bounced back from $1.16 support after retracing by over 20% since yesterday’s ATH. At the time of writing, ADA maintained its position as the world’s third-largest cryptocurrency with a market cap of over $40 billion. Gains over the last 30 days stood strong at over 255% and highlighted the crypto asset’s strong uptrend. However, the indicators flashed mixed signals on its future trajectory.
The Stochastic RSI showed a saturation of sellers in the market and a bullish crossover could boost the price moving forward. On the other hand, the Awesome Oscillator showed that momentum moved back and forth between the buyers and sellers over the last few sessions. A rise towards record levels was certainly on the cards and a spike in the 24-hour trading volumes could trigger a strong rally. Conversely, a move below the current support would present the next line of defense at the $1 mark.
IOTA
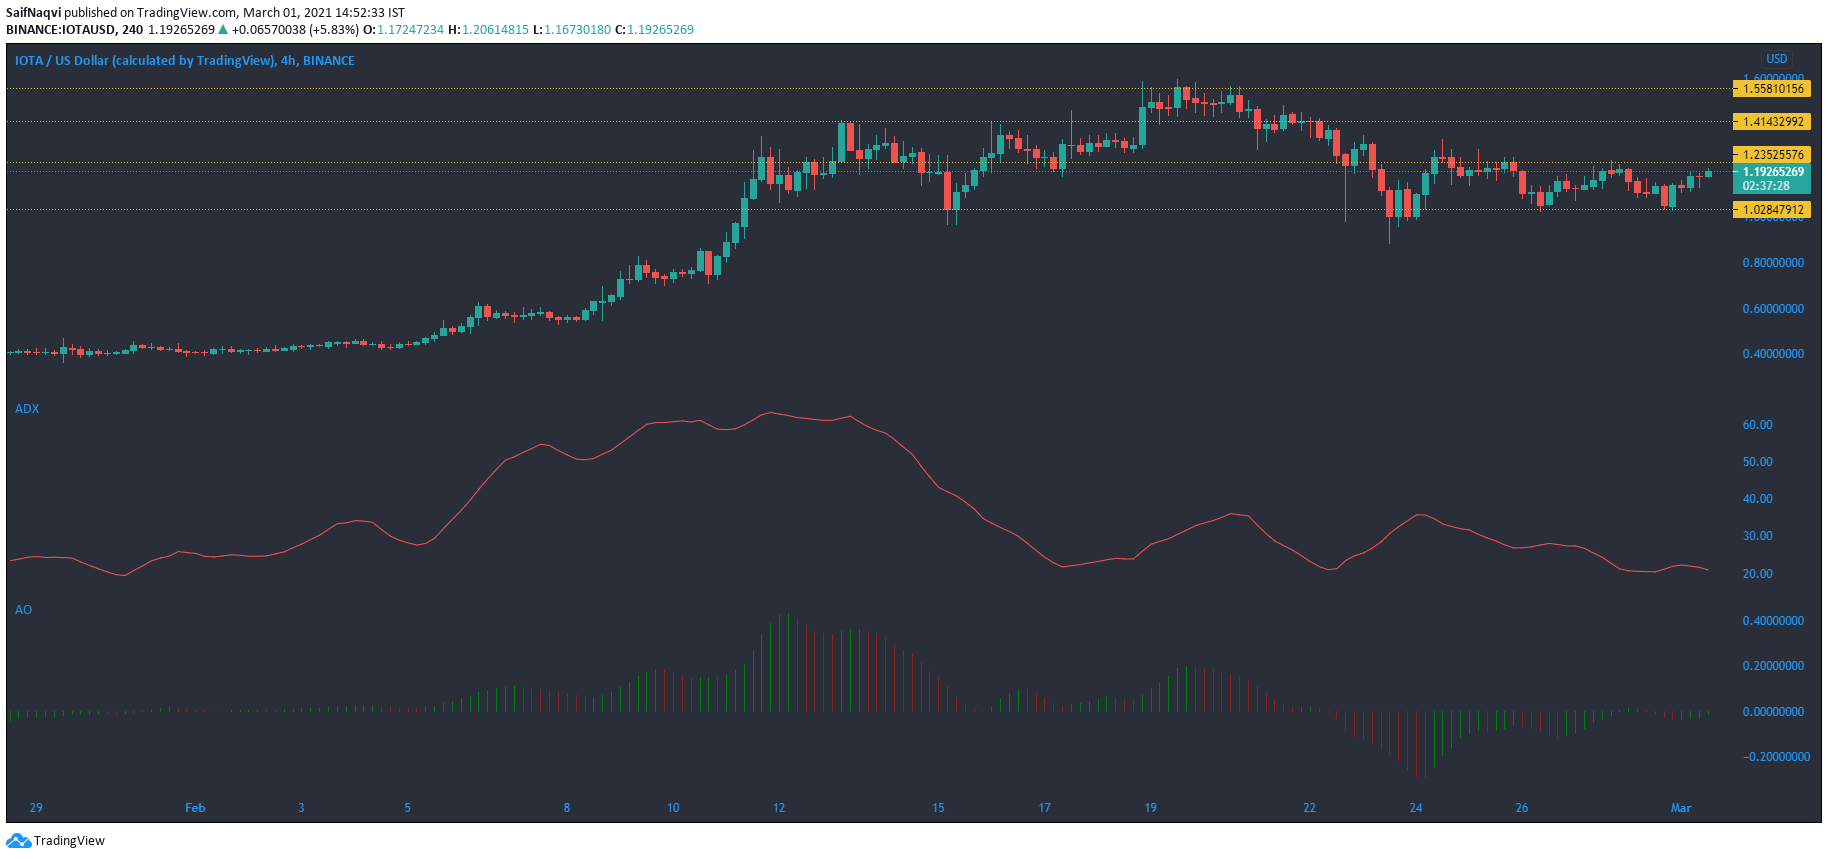
A look at IOTA’s 4-hour chart highlighted the cryptocurrency’s arduous attempt at a recovery after the price dropped below the $1 mark post Bitcoin’s pullback from $58,000. The ADX Indicator on IOTA pointed lower from the 20-mark and showed the lack of a strong trend as the price moved between the $1.23 to $1.04 range. The Awesome Oscillator was bullish-neutral.
A rise above the $1.23 level would present the next upside at $1.41. However, trading volumes and buying activity were insignificant to back a move above the press time resistance.
Dogecoin [DOGE]
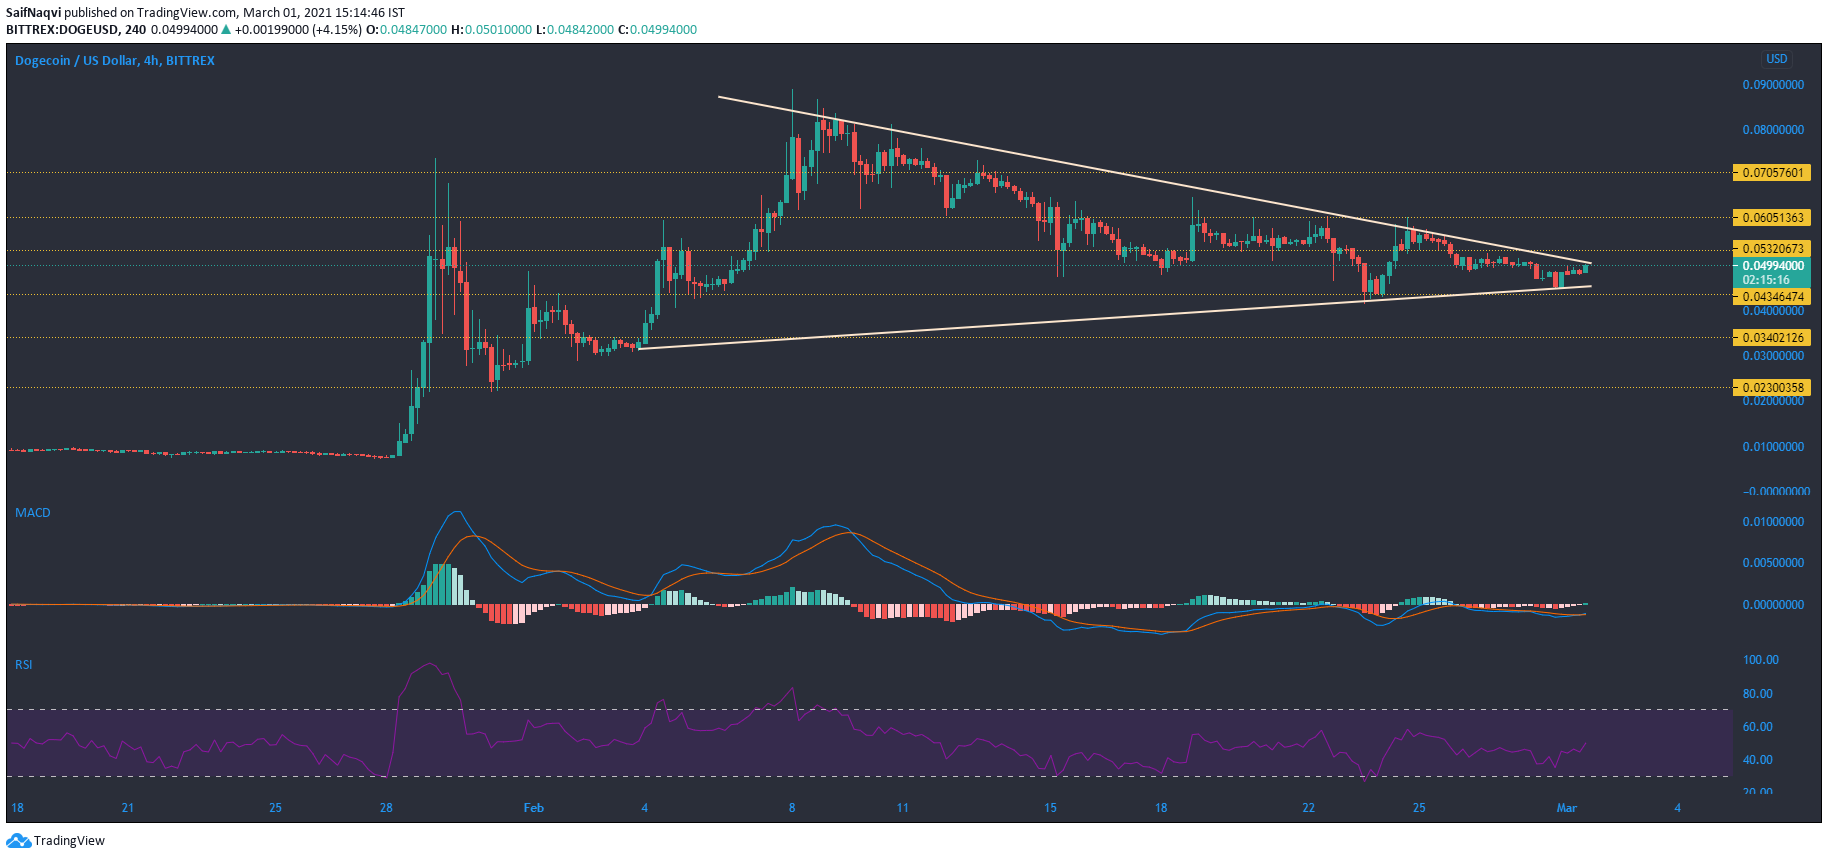
Dogecoin formed a symmetrical triangle on its 4-hour chart as the price moved between two converging trendlines. Trading volumes were on the lower side and consistent with a breakout pattern. The pattern usually follows an upwards breakout and DOGE could move north, towards $0.07 resistance in a bullish outcome. The RSI pointed upwards from the 50-mark, while the MACD also tipped slightly in favor of the bulls after the fast-moving line moved above the signal line.
However, considering the nature of the broader market over the past week, a bearish outcome could not be discounted as well. A downwards breakout could see DOGE test support levels at $0.034 and $0.023.