Cardano, IOTA, Enjin Coin Price Analysis: 10 April

Cardano moved within an ascending triangle and projected a break above $1.50 in a bullish outcome. IOTA was expected to dip towards $1.75 support after forming its latest local high. Lastly, Enjin Coin could see an extended sell-off if the price broke below $2.68-support.
Cardano [ADA]

Source: ADA/USD, TradingView
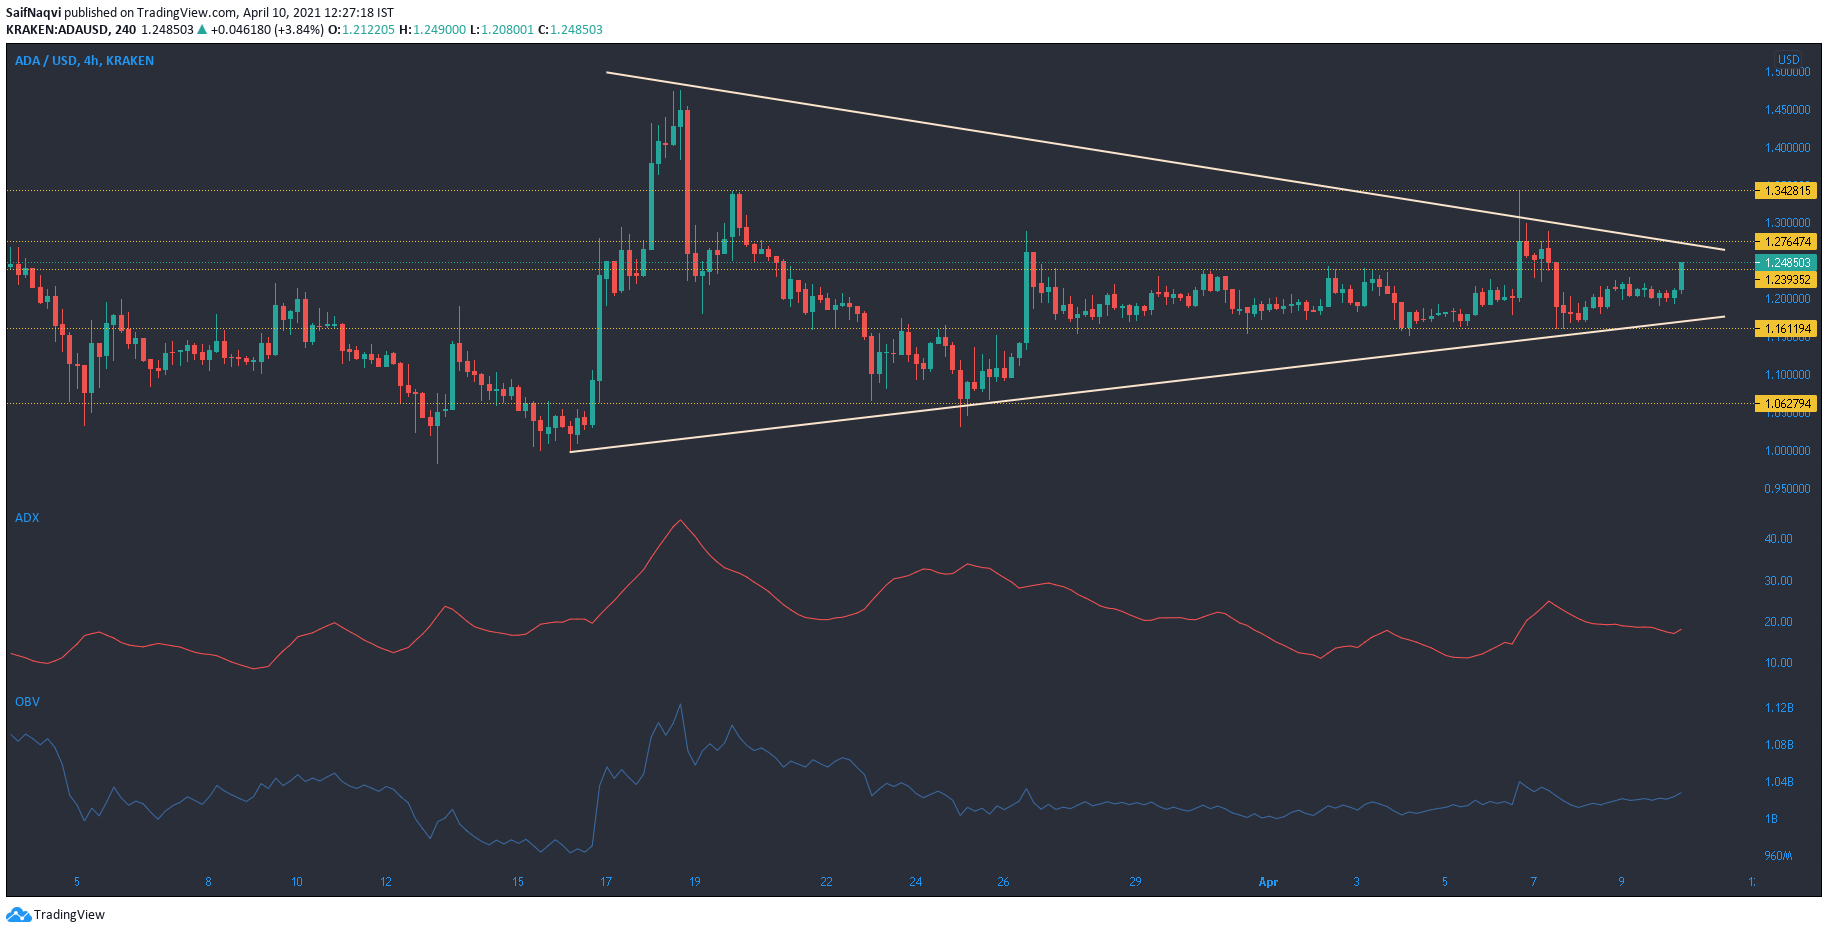
Judging by Cardano’s movement since mid-March, the price made three lower highs and three higher lows heading into April 10. A symmetrical triangle formed in the process ad this presented a chance of an upwards breakout. Even though ADA has been consolidating between $1.27-$1.16 over the last two weeks, the market was gathering momentum for the next big price swing.
However, with the OBV trickling north over the past few days and the ADX still shy of the 25-mark, the market was still expected to trade sideways within the short-term. The long term expectation was for a a breakout above $1.27-resistance, and this would likely boost ADA above the $1.50-level.
IOTA

Source: IOTA/USD, TradingView
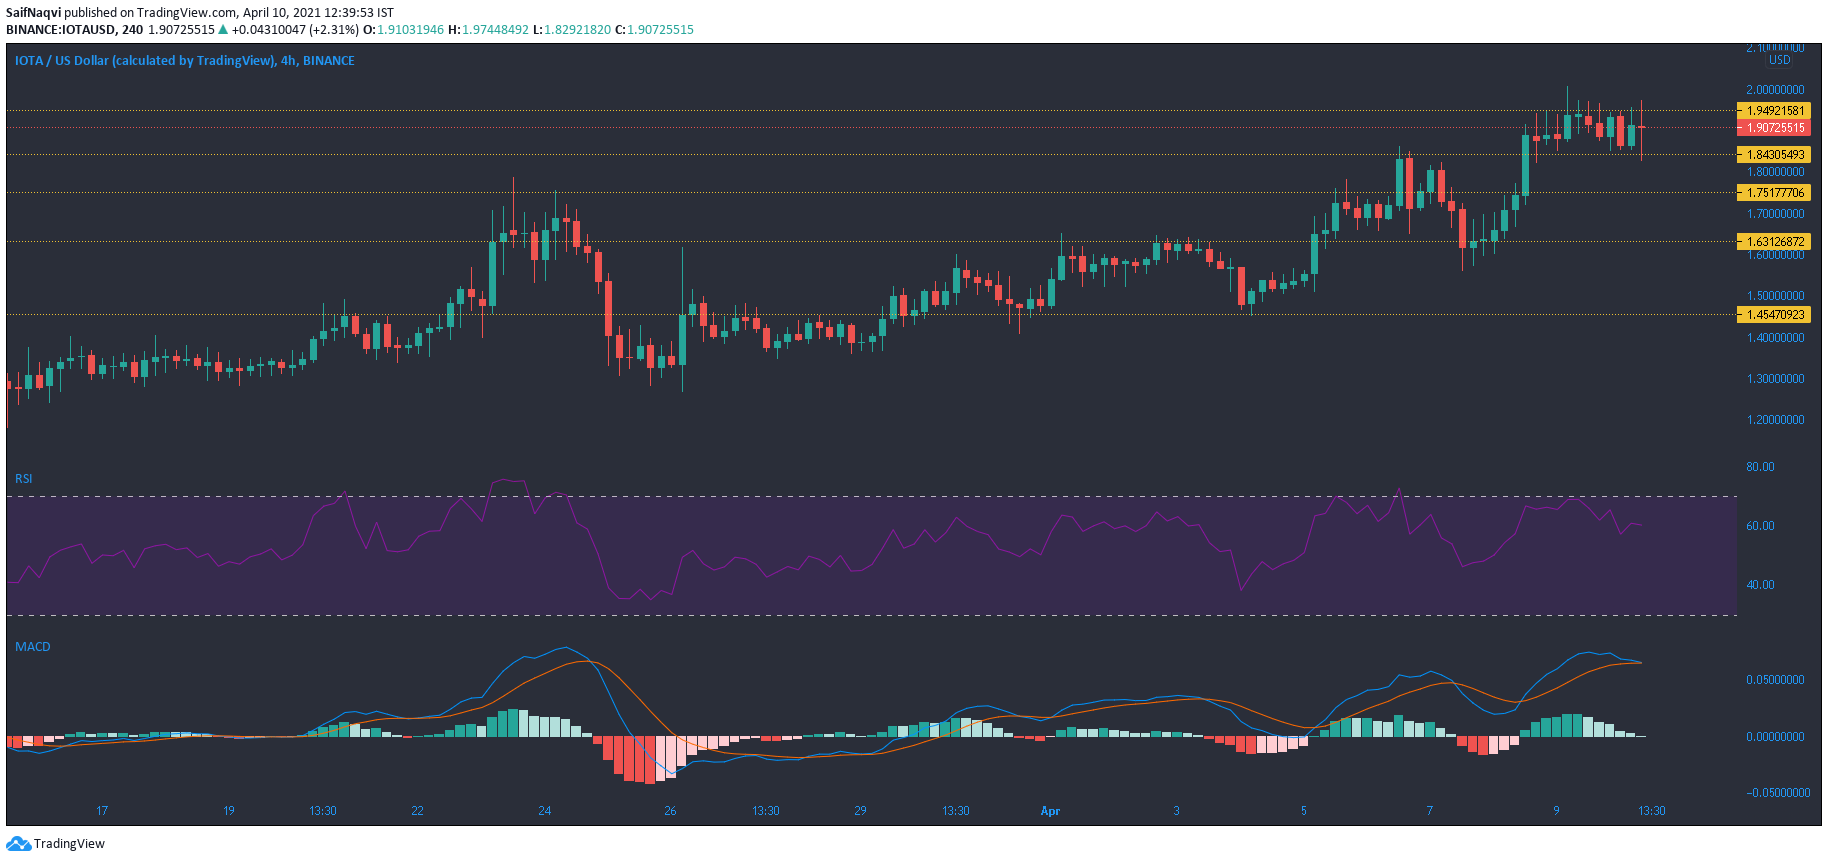
2021 has been a good year for IOTA so far. Year-to-date gains have amounted to over 550% and the price has formed new local tops heading into each month. However, these tops were soon followed by a correction phase and the price bounced back from various support levels. Since IOTA was already trading close to its latest local high, the expectation was for a minor pullback before resuming its upwards trajectory.
A bearish crossover in the MACD only reinforced this idea. The RSI, while still in bullish territory, was expected to dip below 50 over the coming sessions. Levels to watch out for include support lines at $1.75 and $1.63.
Enjin Coin [ENJ]

Source: ENJ/USD, TradingView
Enjin Coin snapped a newer record high that saw the price touch the $4-mark after a bounce back from support at $2.02. An ascending channel appeared in the process but a breakdown was witnessed over the last few sessions of trade. The price broke below the lower trendline and moved closer to a support line at $3.10.
The RSI reversed from the overbought territory and pointed south from 60. During the previous rally, the RSI formed 4 peaks in the upper zone before reversing the trajectory. If the RSI does hold above 50 over the short term, the same can be expected moving forward as well. This would push ENJ towards $4.5 or even $5. Meanwhile, the Awesome Oscillator noted two consecutive red bars as momentum looked to shift sides. Support at $2.68 could be in focus in the event of a breakdown, but a move below this level and the 50-SMA (blue) would lead to an extended sell-off.


