Cardano Price Analysis: 09 April

The past few weeks have seen good news roll in for the Cardano ecosystem. The CEO Charles Hoskinson revealed that Cardano was planning to give importance to the NFT marketplace and that his team had already negotiated with several of the top-10 NFT marketplaces about porting them over to Cardano.
He had also spoken at the Blockchain Africa Conference, revealing that they were on “the cusp of deals and initiatives” through public-private partnerships with certain countries in Africa, paving the way for millions of users to enter the ecosystem. The IOHK team also detailed the implementation of the latest Cardano hard fork, Alonzo.
On the charts, ADA was consolidating at the $1.2 mark and did not show rising bullish momentum yet. A rise above $1.27 and $1.34 is needed to signal a move back toward the $1.5 highs.
Cardano 1-day chart
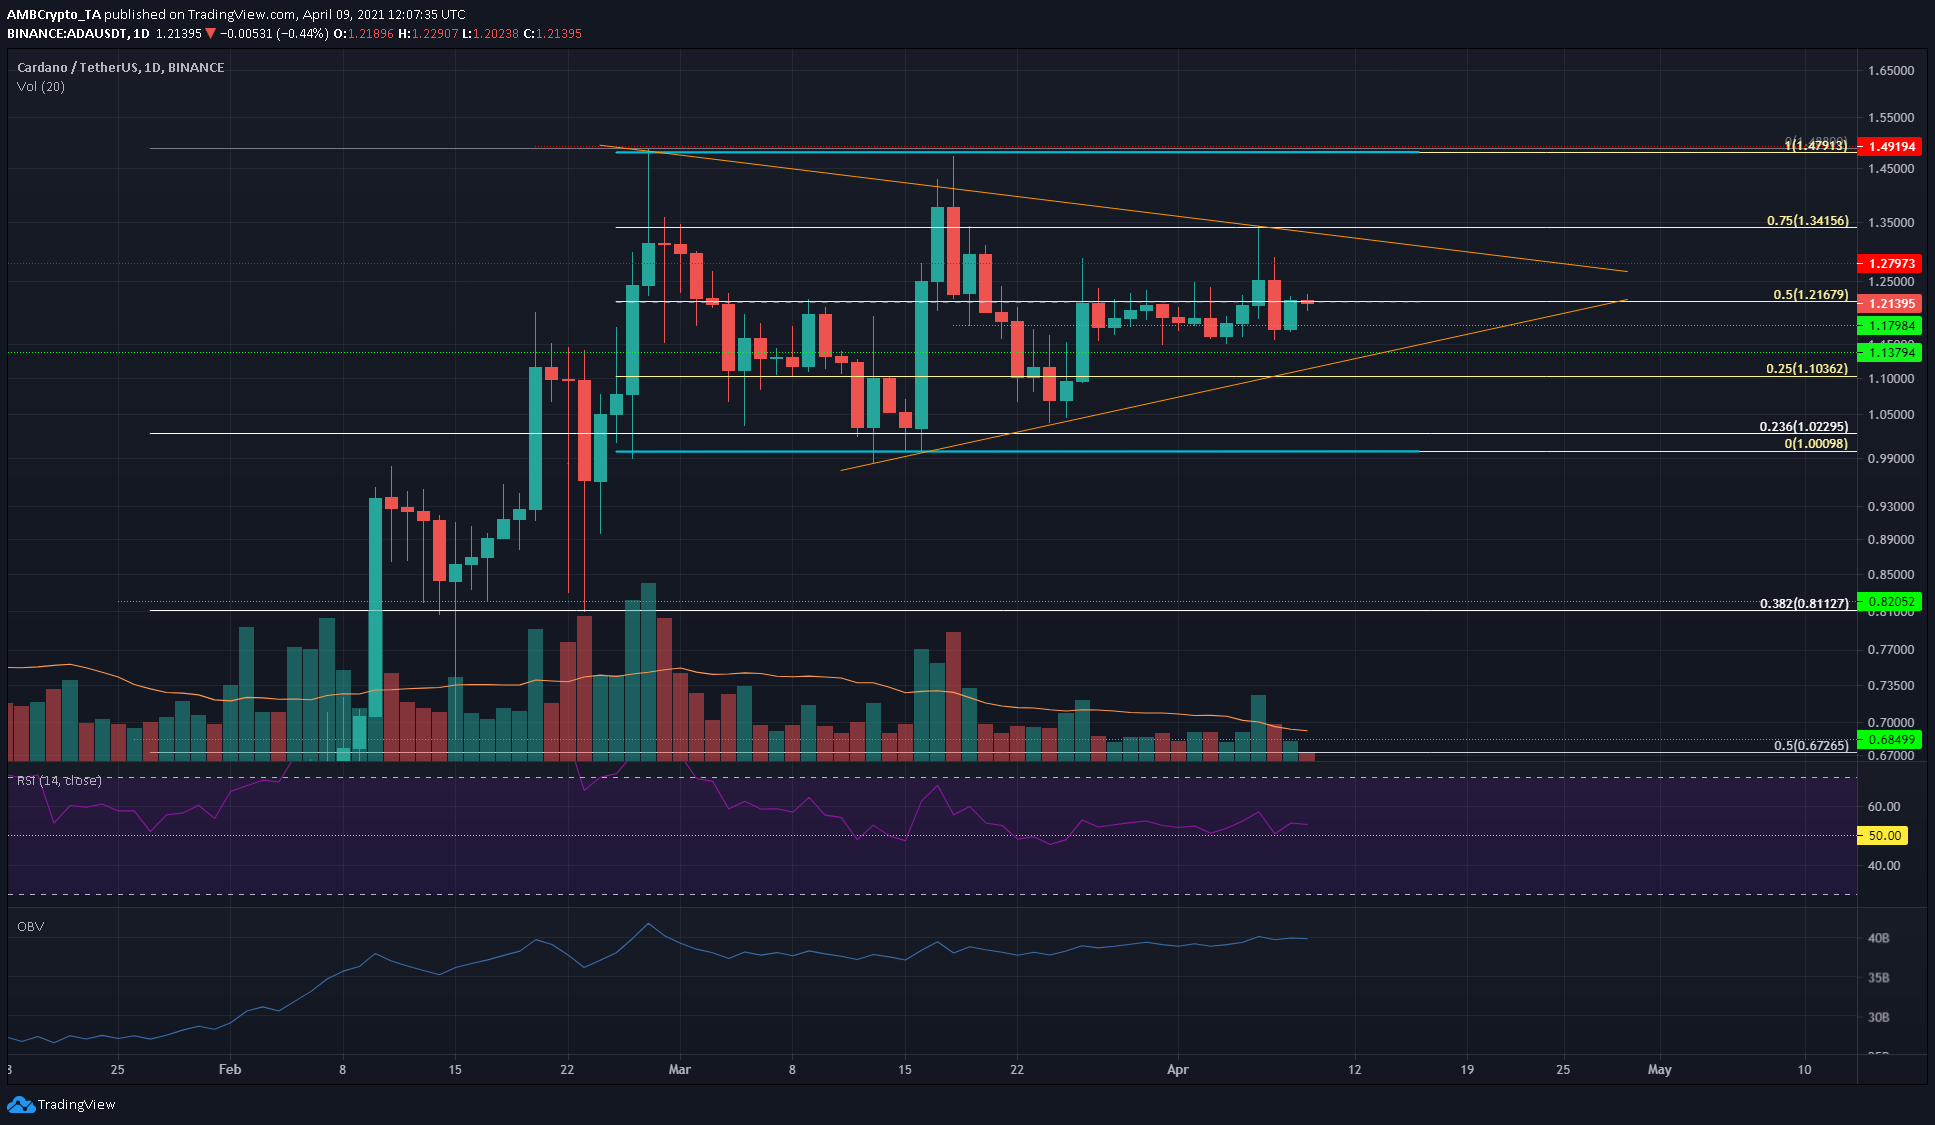
On the daily chart, the past ten days have seen the market open in the $1.16-$1.18 region – a 1.75% spread. While candlewicks on the daily chart have reached as high as $1.27 and $1.34 but were rebuffed due to selling pressure. The strong surge from $0.82 to $1.5 in the past two months retraced to $1 and demand has since pushed the price upward. Over the past month alone, a range between $1-$1.5 appears to have been established (aqua) with levels of importance (pale yellow) highlighted within this range.
There is also some support to be found at the $1.17 and $1.13 levels, with resistance at $1.27 and $1.34 immediately overhead. A move above these levels was not yet indicated, however, a symmetrical triangle pattern (orange) was spotted.
Rationale
The trading volume has been in a downtrend over the past month, suggestive of a consolidation. Combined with the triangle pattern, consolidation before a bullish breakout appears to be the likely course for ADA.
The RSI was floating just above neutral 50 to show no real momentum in either direction over the past few days. The OBV has been gently trending upward, suggesting some accumulation was in progress.
Conclusion
The long-term outlook for ADA is bullish, and a breakout past the continuation pattern (triangle) would set a technical target of around $1.7 for ADA.