Cardano, Litecoin, NEAR Price Analysis: 04 January

Now, the onus was on the king coin to flip the broader sentiment after re-entering the $46,000-zone. While ‘Extreme fear‘ lingered around the market at press time, Cardano and Litecoin flashed weak near-term technical indications. Buyers needed to ramp up volumes to skew the momentum in their favor.
On the contrary, NEAR saw exponential gains over the past day and poked its ATH on 04 January.
Cardano (ADA)
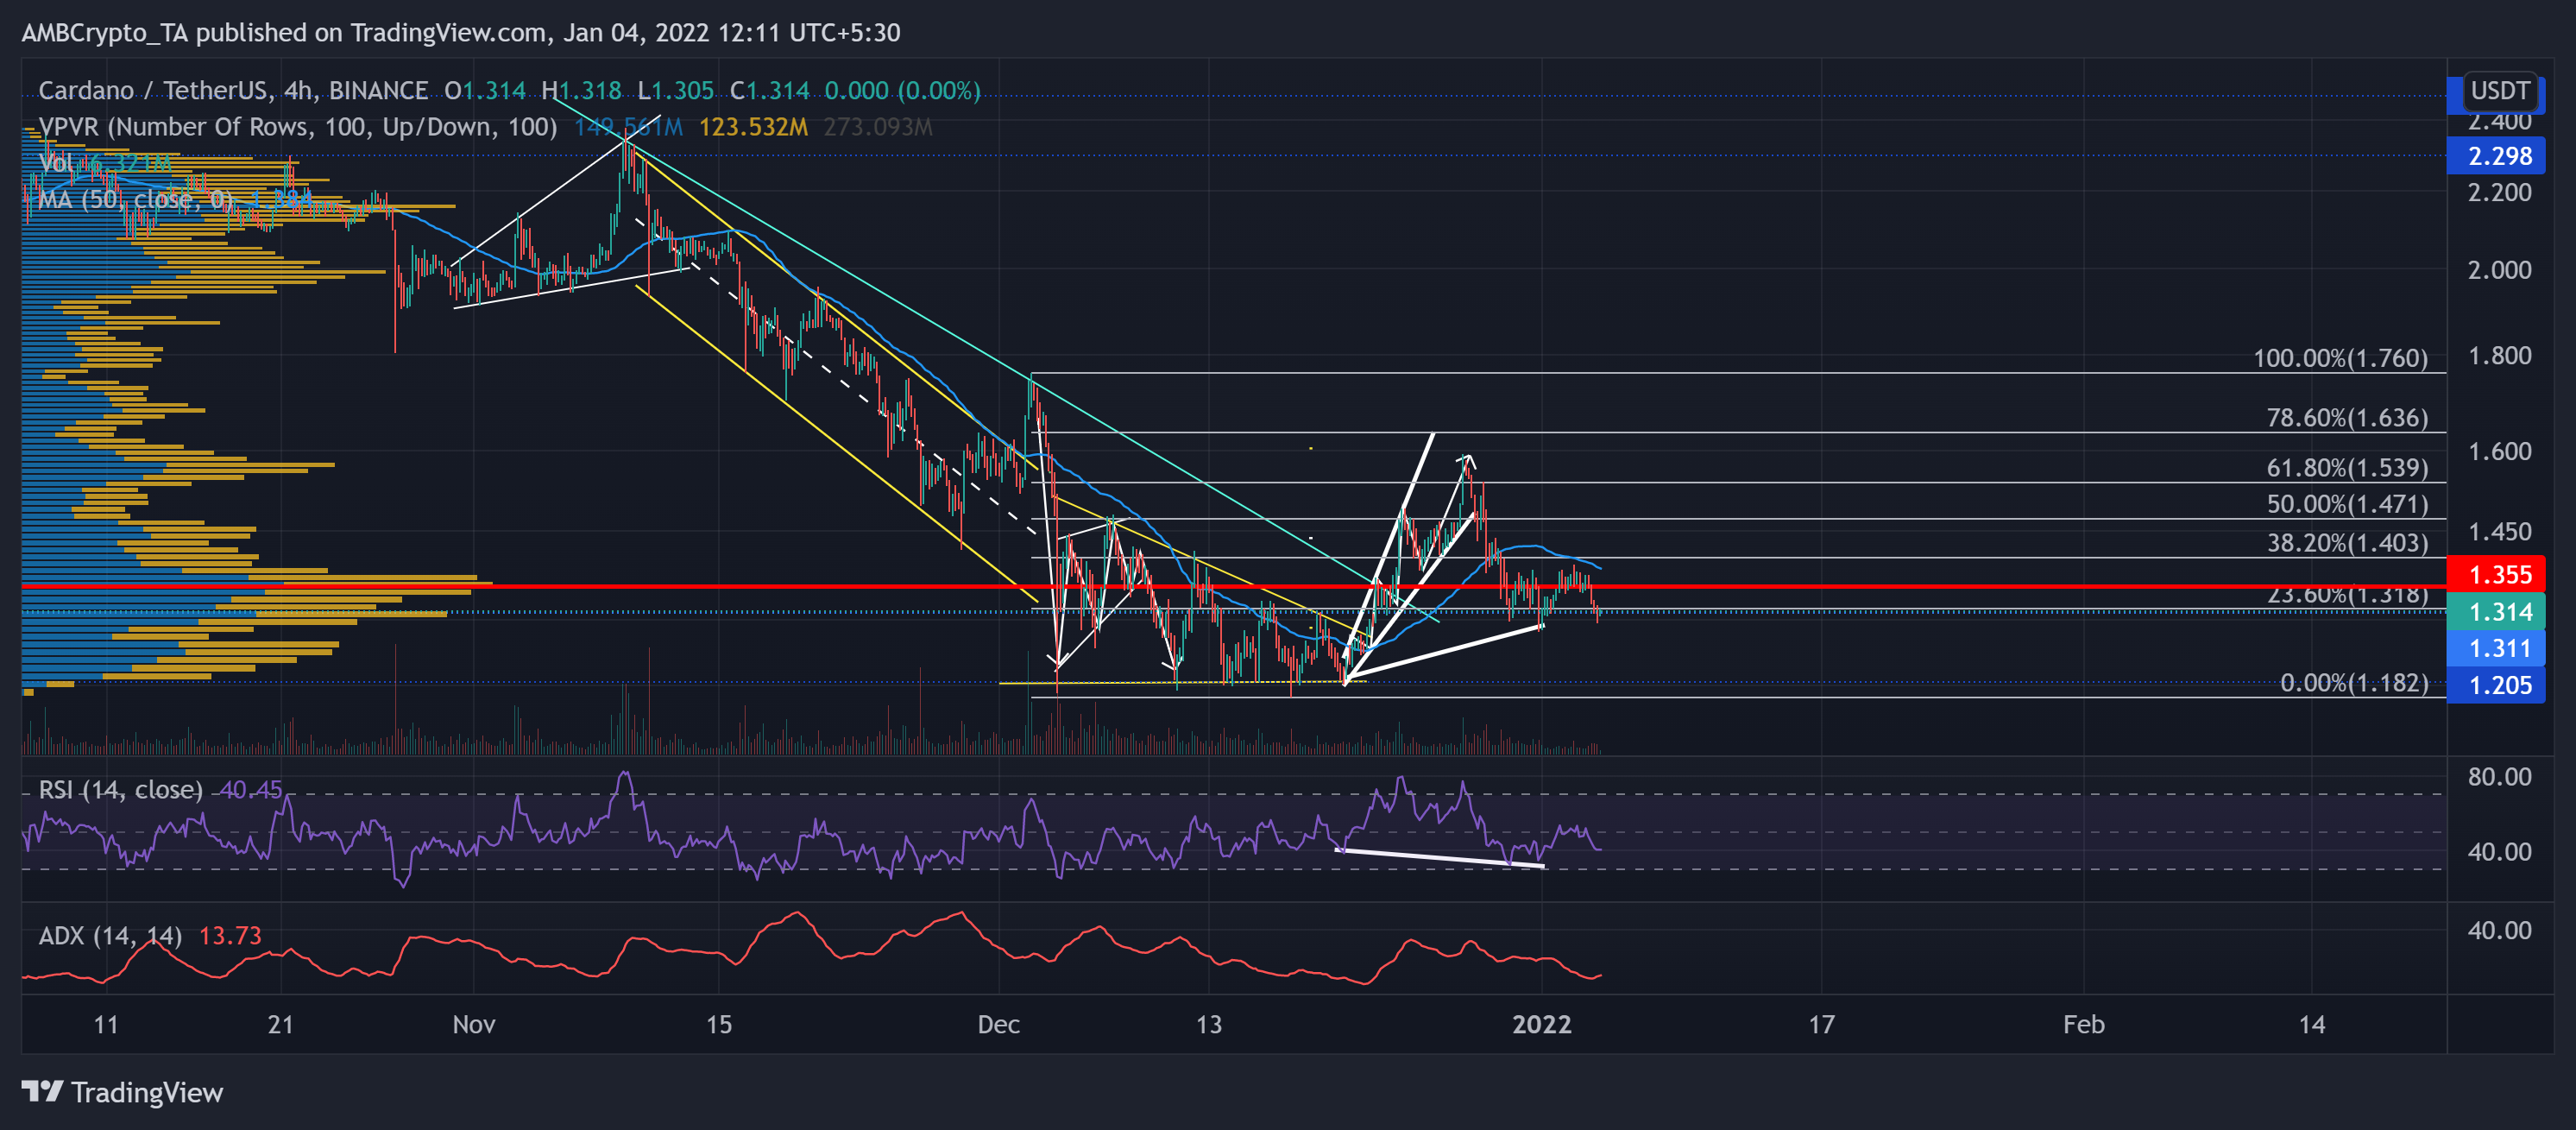
ADA’s ascending wedge (white) tilted after it saw a sharp pullback from near the 61.8% Fibonacci resistance at the $1.53-mark. As a result, it saw a 19. 38% retracement from its three-week high on 27 December until the bears tested the $1.311-level. Nevertheless, the bulls managed to flip this level from previous resistance to immediate support.
The alt traded below the area that offered the highest liquidity (Point of Control [red]) for over three months. Thus, revealing a bearish sentiment. Now, immediate resistance stood near the Point of control and the 38.2% Fibonacci level.
At press time, ADA traded at $1.314 after noting a 3.28% 24-hour loss. The RSI upturned after a bullish divergence (white) with price action. But could not sustain above the half-line. Recently, the pullback volumes have been higher than the incline volumes hinting at a weak bullish motion. However, the ADX displayed a weak directional trend for the alt.
Litecoin (LTC)
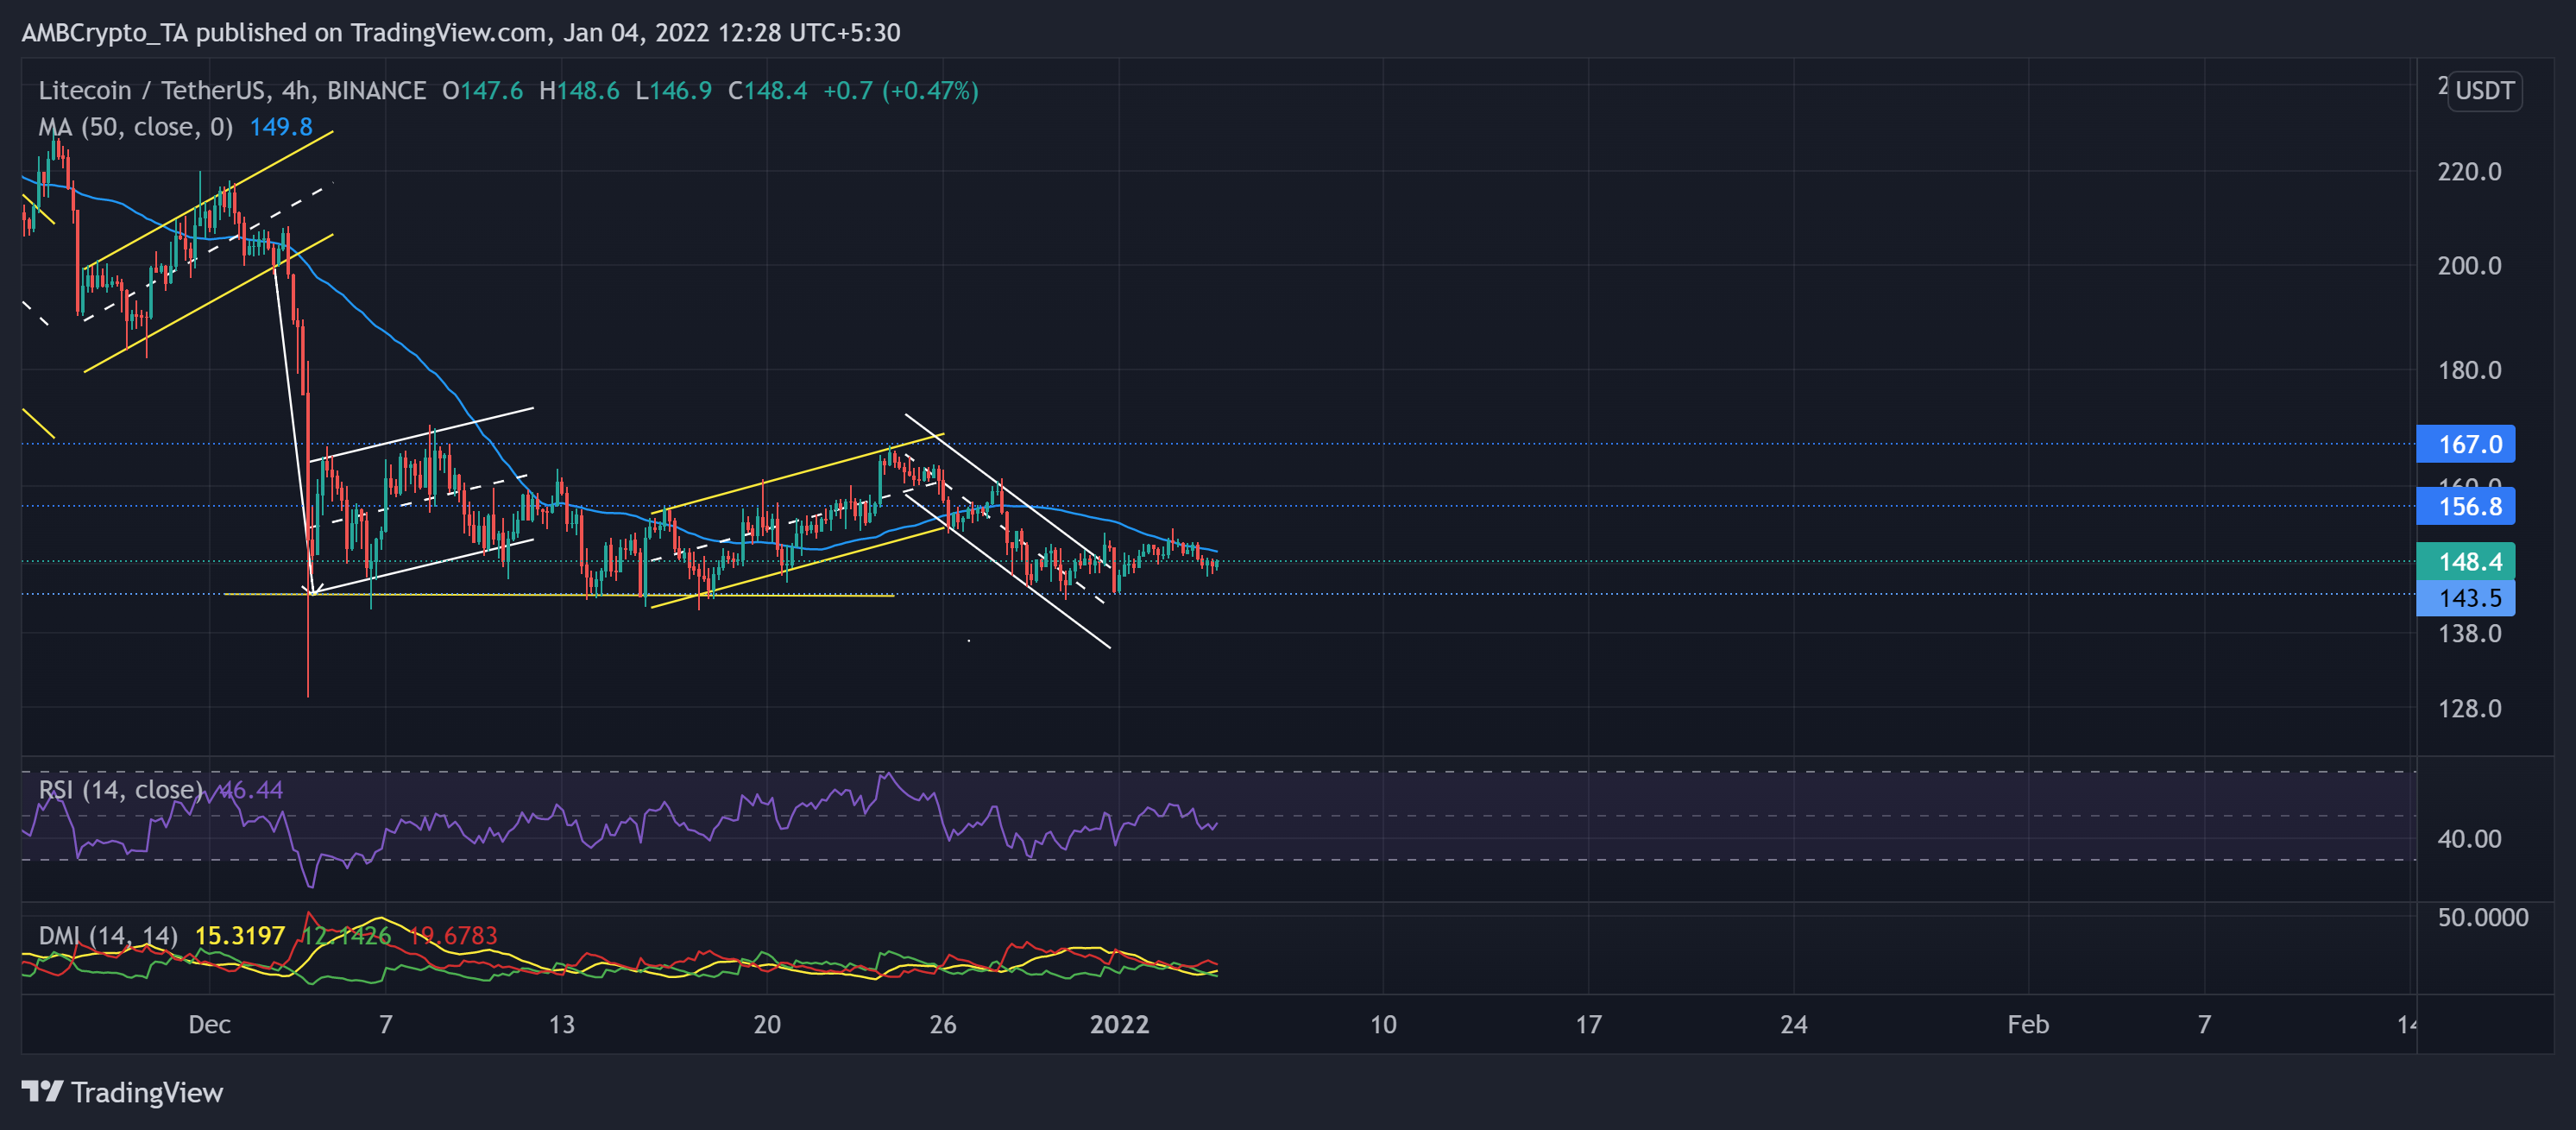
LTC managed to find an oscillating range between the $167 and $143-makr for over a month now. Thus, the price reversed from its immediate support that coincided with the lower trendline of the down-channel (white).
The bulls upheld the $143 support level for nearly five months now while the bears kept retesting it multiple times. Now, as we see a down-channel breakout, the immediate hurdle was near the 50-SMA (cyan).
At press time, LTC traded at $148.4. The RSI struggled to mark a convincing close above the half-line for the past ten days. Also, the DMI flashed a bearish bias while the ADX displayed a weak directional trend.
Near Protocol (NEAR)
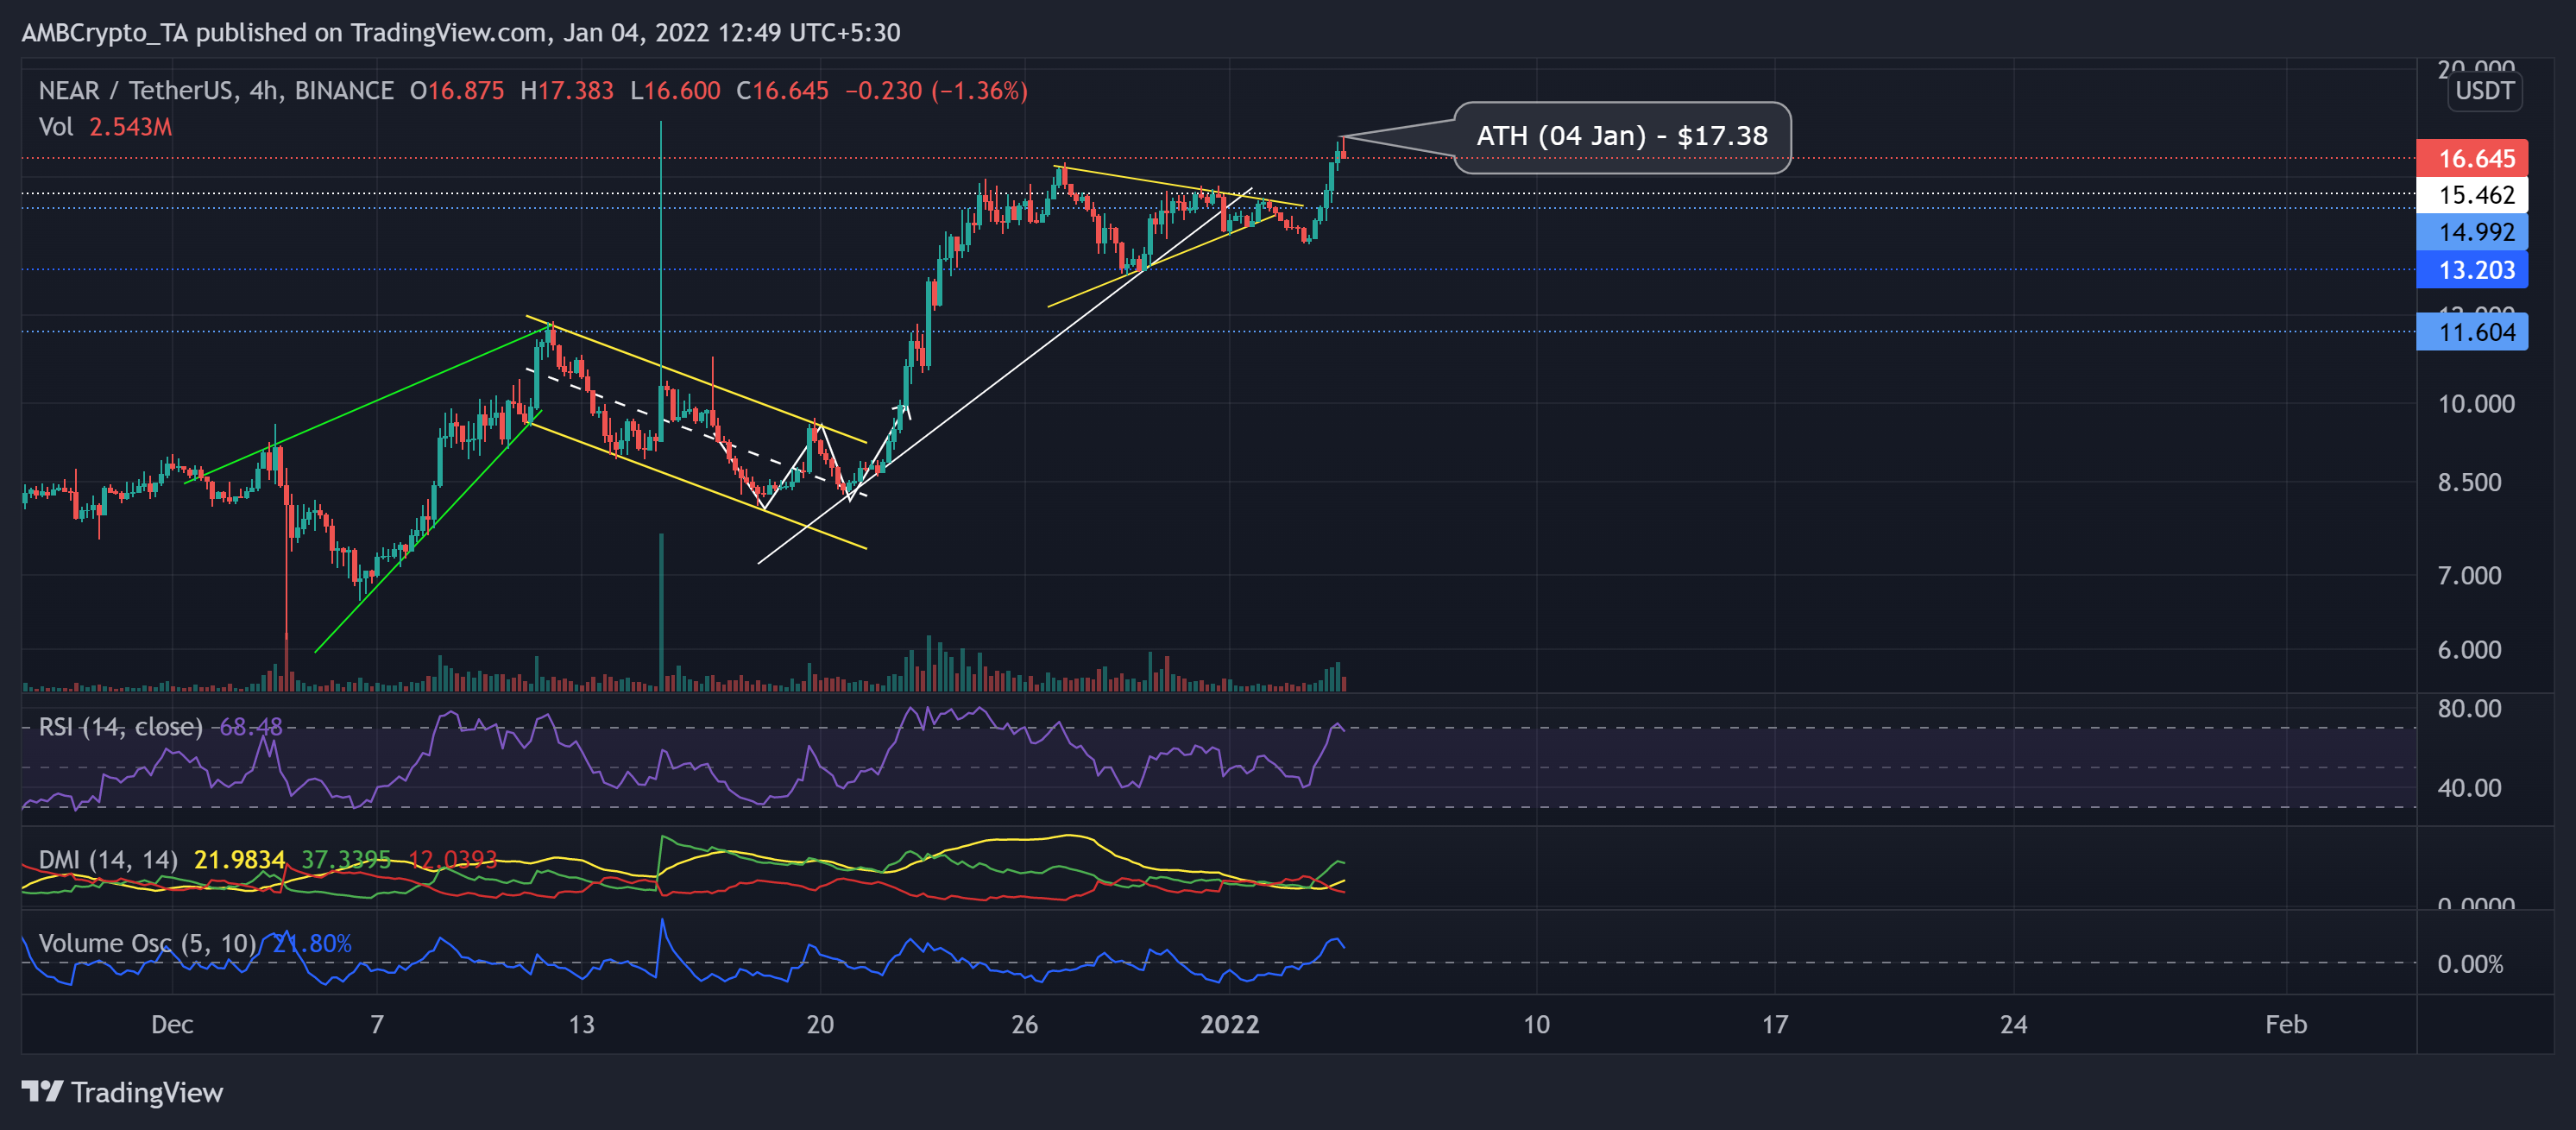
After a mid-December down-channel (yellow) breakout, NEAR marked exponential gains. It jumped by a staggering 113.21% from the 20 December low and poked its ATH at $17.38 on 04 January.
After forming a symmetrical triangle, it breached its bullish trendline (white) support. However, NEAR marked a 25.11% 24-hour gain to poke its lifetime milestone. Any further pullout would find testing grounds at the $15.4 to $14.9 range.
At press time, the alt traded at $16.645. The RSI dipped slightly below the overbought region. Also, the DMI reaffirmed the bullish vigor. However, the ADX displayed a slightly weak directional trend for the alt. The recent bullish movement also marked higher peaks on the volume oscillator, indicating a healthy trend.