
The short-term market has experienced wild periods of volatility while the long-term market seem to be picturing an effort towards stabilizing the price. Altcoins like Cardano [ADA], Polygon [MATIC], and Tron [TRX] did suffer a blow in value, but at the time of writing, the market was trying to recover.
Cardano [ADA]
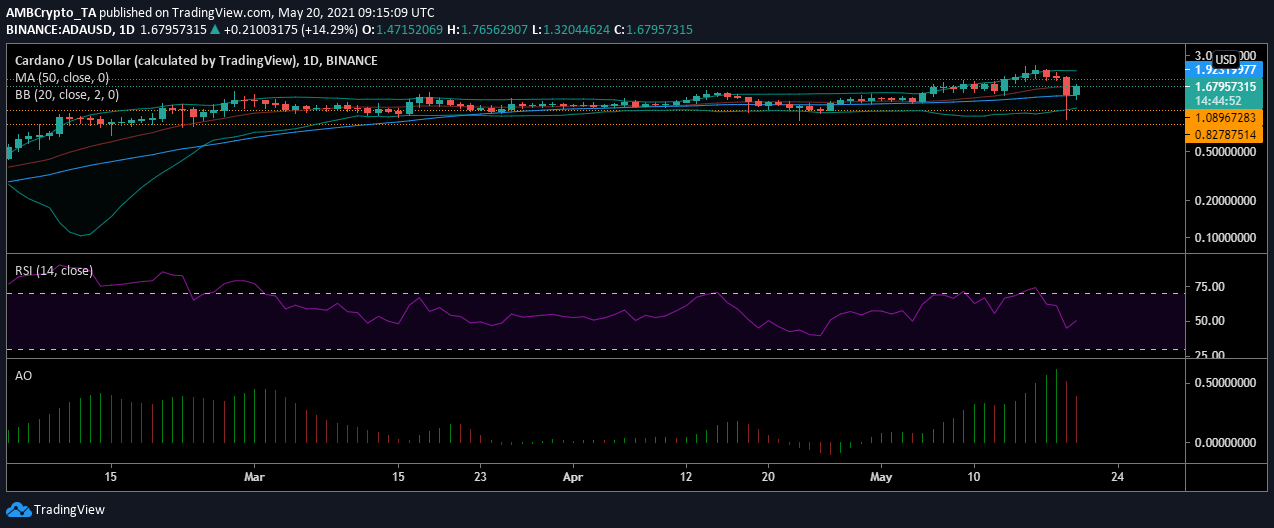
Source: ADAUSD on TradingView
After a day of a brutal attack on the value of Cardano, it was all set to make a recovery. It was only four days back when it hit an all-time high of $2.51, following which, it slid down by almost 60% to $0.9179 briefly. As the ADA market recovered, the price appreciated to $1.61 on the charts.
The alt’s price may continue to trend above $1.48 as the immediate support was marked there, given the buying pressure remained stable at the press time level. According to the Relative Strength Index, the asset had dropped from being overbought and was hovering close to equilibrium.
This meant that the selling pressure helped to relieve the buyers’ saturation and now, with the RSI at equilibrium, the buying and selling pressures were evened out. However, the market was losing the momentum and that could have some bearish implications.
Polygon [MATIC]

Source: MATICUSD on TradingView
MATIC hit an all-time high on 18 May at $2.87, but like Cardano, its value has also been on a downtrend. The alt’s value dropped to $1.01 subsequently and bounced back as a level of support was established here. The price later recovered to $1.91, with the market trend suggesting that it was close to being overbought.
As per the Relative Strength Index, MATIC had remained in the overbought zone from 13th to 18th May and fell just under when the price dropped. The sellers pushed the value of the indicator to 65, a level which was still extremely close to the overbought zone. Despite the price recovering, however, it may not be able to surge past the said level since the market seemed to lack momentum.
It’s worth noting, however, that since the buying pressure remain high, the money remained in the market.
Tron [TRX]

Source: TRXUSD on TradingView
Tron [TRX], on the other hand, was seeing bearish control over its market. The cryptocurrency was trading around the support of $0.1152 when the sell-off pushed its value to $0.0055. As the market recovered, TRX’s value was pushed up to $0.0848, but the overall sentiment was bearish.
This was underlined by the Signal line which crossed over the candlesticks, a development that pointed to the price trending lower. On the contrary, the Bollinger Bands were diverging – A sign of more price action making its way to the TRX market. However, this could result in the price being pushed lower as the selling pressure was high.
The Relative Strength Index had slipped close to the oversold zone and was reporting a value of 35. The selling pressure remained dominant and with the MACD also crossing under the Signal line, the bearishness was more pronounced in the market.