Cardano, NEAR, ICP Price Analysis: 03 February

With the Bitcoin fear and greed index yet again drifting into an extreme fear sentiment, Cardano and Near continued their near-term consolidation phase. Thus, forming bearish pennants on their 4-hour charts. Also, ICP revealed decreasing buying vigor while the buyers needed to step in at the 20 EMA to prevent a further downfall.
Cardano (ADA)
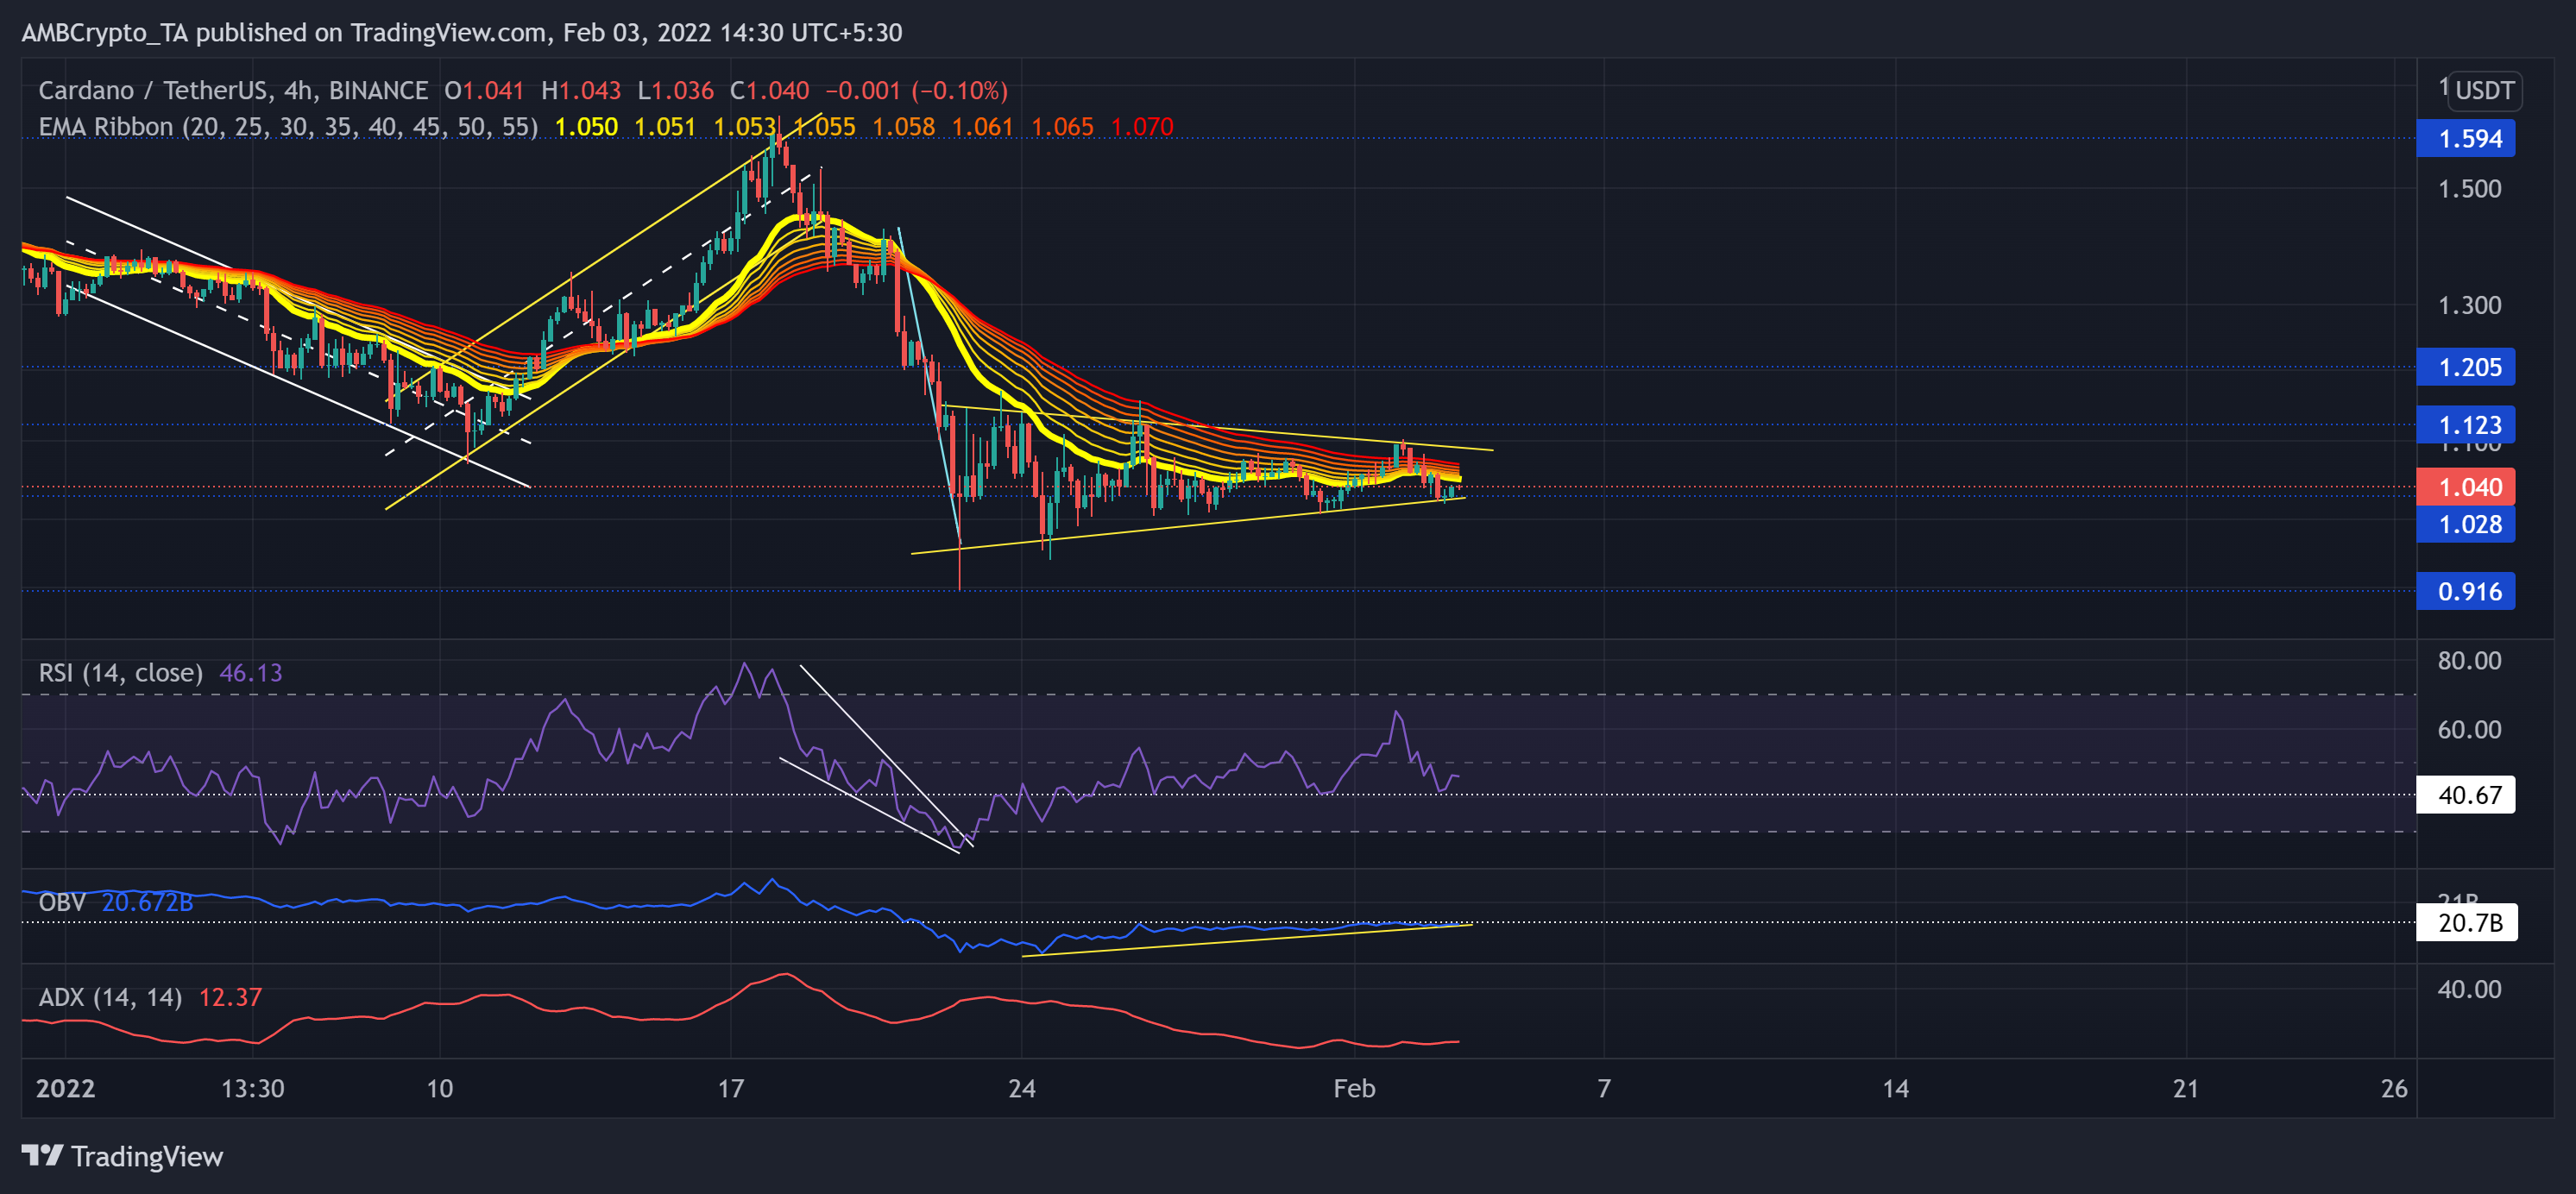
The recent up-channel (yellow) breakdown from the $1.59-mark led ADA bears to test the $1.04-level multiple times over the past 12 days. The alt fell by 44.2% (from 18 January) and poked its nine-month low on 22 January.
Thus, ADA fell below its EMA ribbons and even lost the vital $1.12-mark resistance. Over the last two weeks, the alt formed a bearish pennant pattern on its 4-hour chart. While the EMA lines still posed a challenge, the upper trendline of the pennant stood as strong resistance.
At press time, ADA traded at $1.04. The RSI reclaimed the 40-mark support continued to display a bearish edge. Further, the OBV was in a gradual ascent and affirmed the increasing buying power. But the ADX flashed a substantially weak directional trend for the alt.
Near Protocol (NEAR)
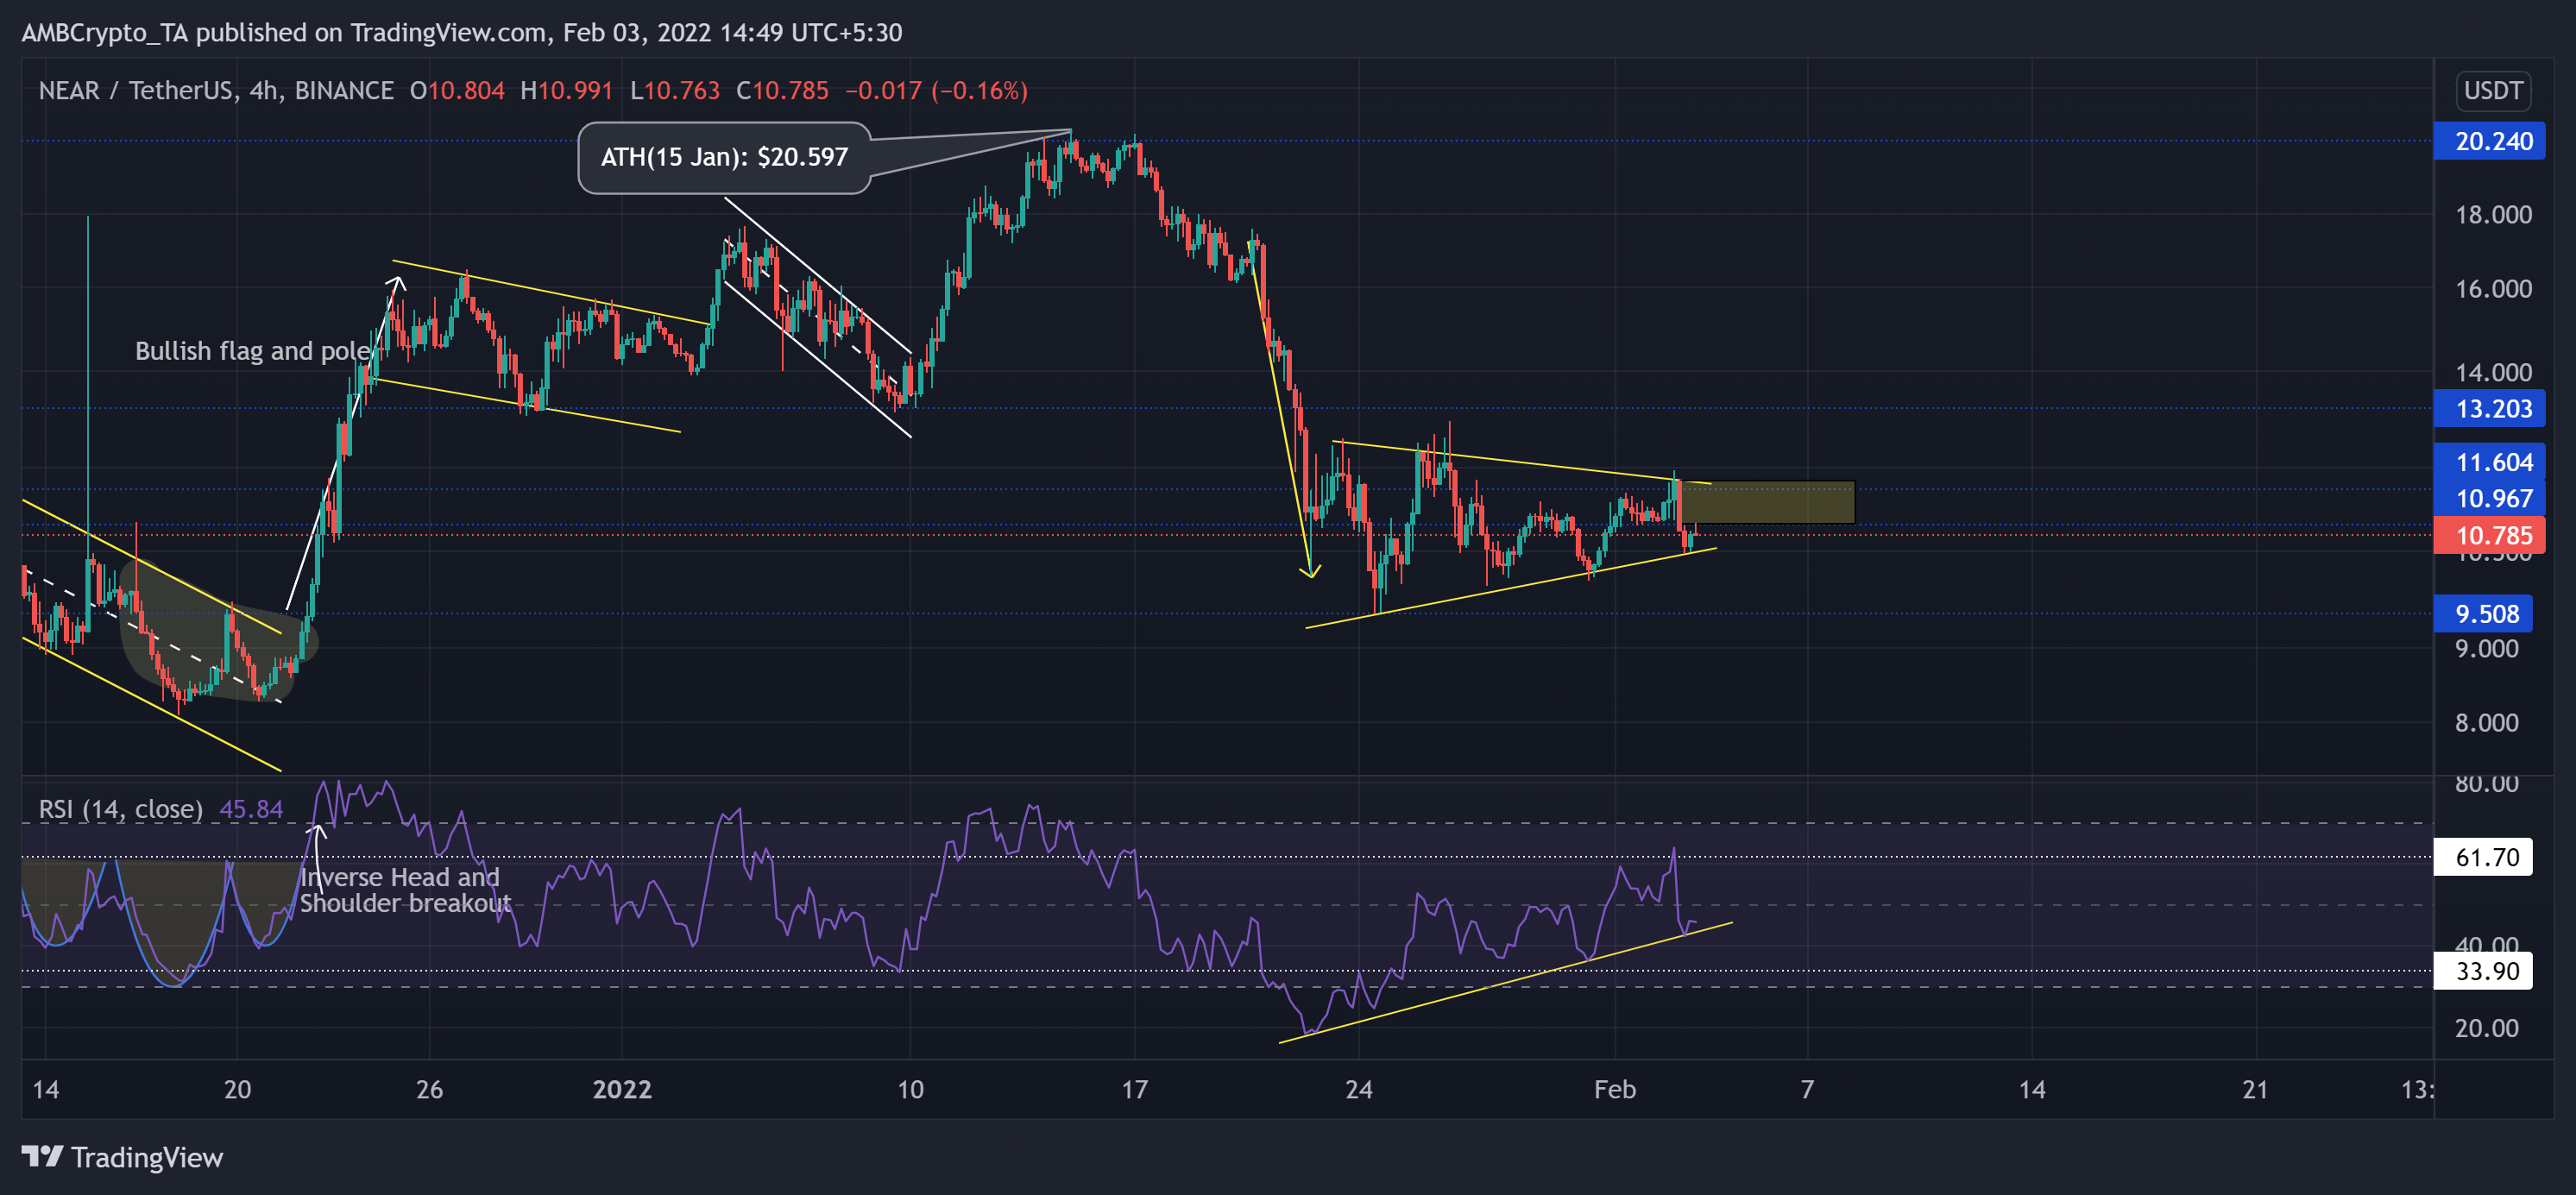
Since its ATH on 15 January, NEAR lost 53.83% of its value and poked its one-month low on 24 January. Moreover, it also lost its crucial $11.6-level resistance (previous support).
Like ADA, Near witnessed a bearish pennant on its 4-hour chart. Now, the immediate hurdle for bulls stood at the immediate supply zone (rectangle, yellow).
At press time, the alt was trading at $10.785 after noting a 2.2% 24-hour loss. After plunging to its record low, the RSI saw a solid revival in the past 12 days. It still depicted a bearish edge as it struggled to sustain itself above the equilibrium.
Internet Computer (ICP)

The recent up-channel (yellow) found a convincing close above the 38.2% Fibonacci resistance. However, the sellers ensured to step in at the 50% level and exert sustained pressure.
Since the up-channel breakdown, the 20 EMA (cyan) stood as strong resistance while the bulls flipped it to support over the past two days. Any close below this level could propel a restest of the lower trendline (yellow).
At press time, the ICP traded at $20.95 after noting a 13.7% three-day gain. The RSI seemed to undertake a patterned breakout and test its midline support. Any close below the 50-mark would confirm the heightened bearish influence. To top it up, the Squeeze Momentum Indicator now flashed grey dots, entailing a high volatility phase.