AVAX fails to climb past the $75 level, can it head back to $50

Disclaimer: The findings of the following analysis are the sole opinions of the writer and should not be considered investment advice
In a previous article, the possibility of a bearish retest of the $75 level was explored. At press time, it appeared that such a retest might already have occurred for Avalanche. Even though some gains were registered in the past couple of weeks, the market structure remained stubbornly bearish and the previous lower highs at $95 looked light-years away, considering recent market conditions. It appeared likely AVAX could drop toward the $50 demand area once again.
AVAX- 12H

Based on the move from $147 to $75.5, a set of Fibonacci retracement lines (yellow) were plotted which gave the $56.05 as the 27.2% extension level for this move. 27.2% and 61.8% are generally extension levels where the trend sees a reaction in the opposite direction.
The $50-$55 area also represented a longer-term area of demand (cyan box).
An ascending trendline was plotted for the past few days for AVAX, and this trendline was broken which indicated that AVAX could retrace its recent gains.
Unless the price can climb past $75.5 and flip it to support, it would remain a likelihood for AVAX to post further lows in the days or weeks to come.
Rationale
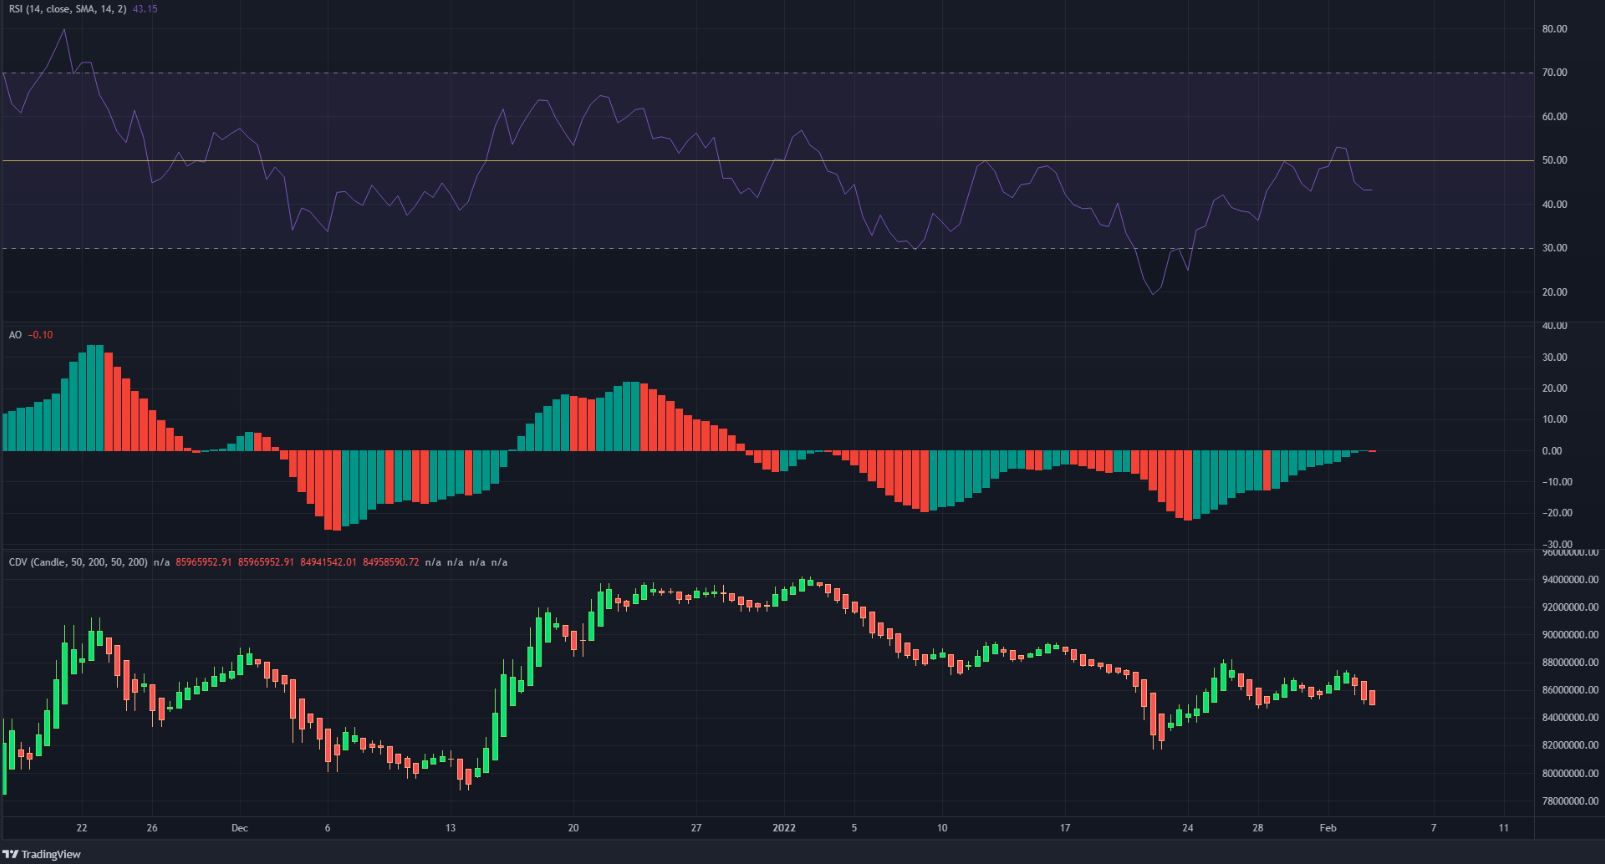
The RSI on the 12-hour chart climbed just above the neutral 50 mark but was immediately pushed under. This showed that, even though momentum was bullish on lower timeframes, the possibility for a fresh leg southward for AVAX was likely.
The Awesome Oscillator also failed to climb significantly past the zero level. It was at the neutral level and could soon be pushed into bearish territory should the price continue its descent.
The CDV showed that the selling volume of the past month far outweighed the buying volume of the recent rally. This was another indication that the move upward was a pullback before a deeper move south.
Conclusion
The indicators showed painted a picture of strong bearishness and selling for AVAX on the 12-hour chart. Until it can claim the $75.5 level as support, it would likely not be feasible to buy the token expecting an appreciation value over the next couple of weeks. The $51.5 and $45 levels could be visited by the price over the next few days/weeks.


