Cardano Price Analysis: 11 March

The past 24 hours saw Bitcoin test the $57,100 area but faced some selling pressure that saw it dip to $54,400, a near 5% drop. Hand-in-hand, Cardano also dipped from $1.17 to $1.11, representing a 5.7% drop. Bitcoin recovered and was trading at $57,000 once more while ADA was a bit slower and held a value of $1.128 at the time of writing. Against BTC, ADA was in a steady downtrend and just above support at the time of writing.
Cardano 1-hour chart

Source: ADA/USDT on TradingView
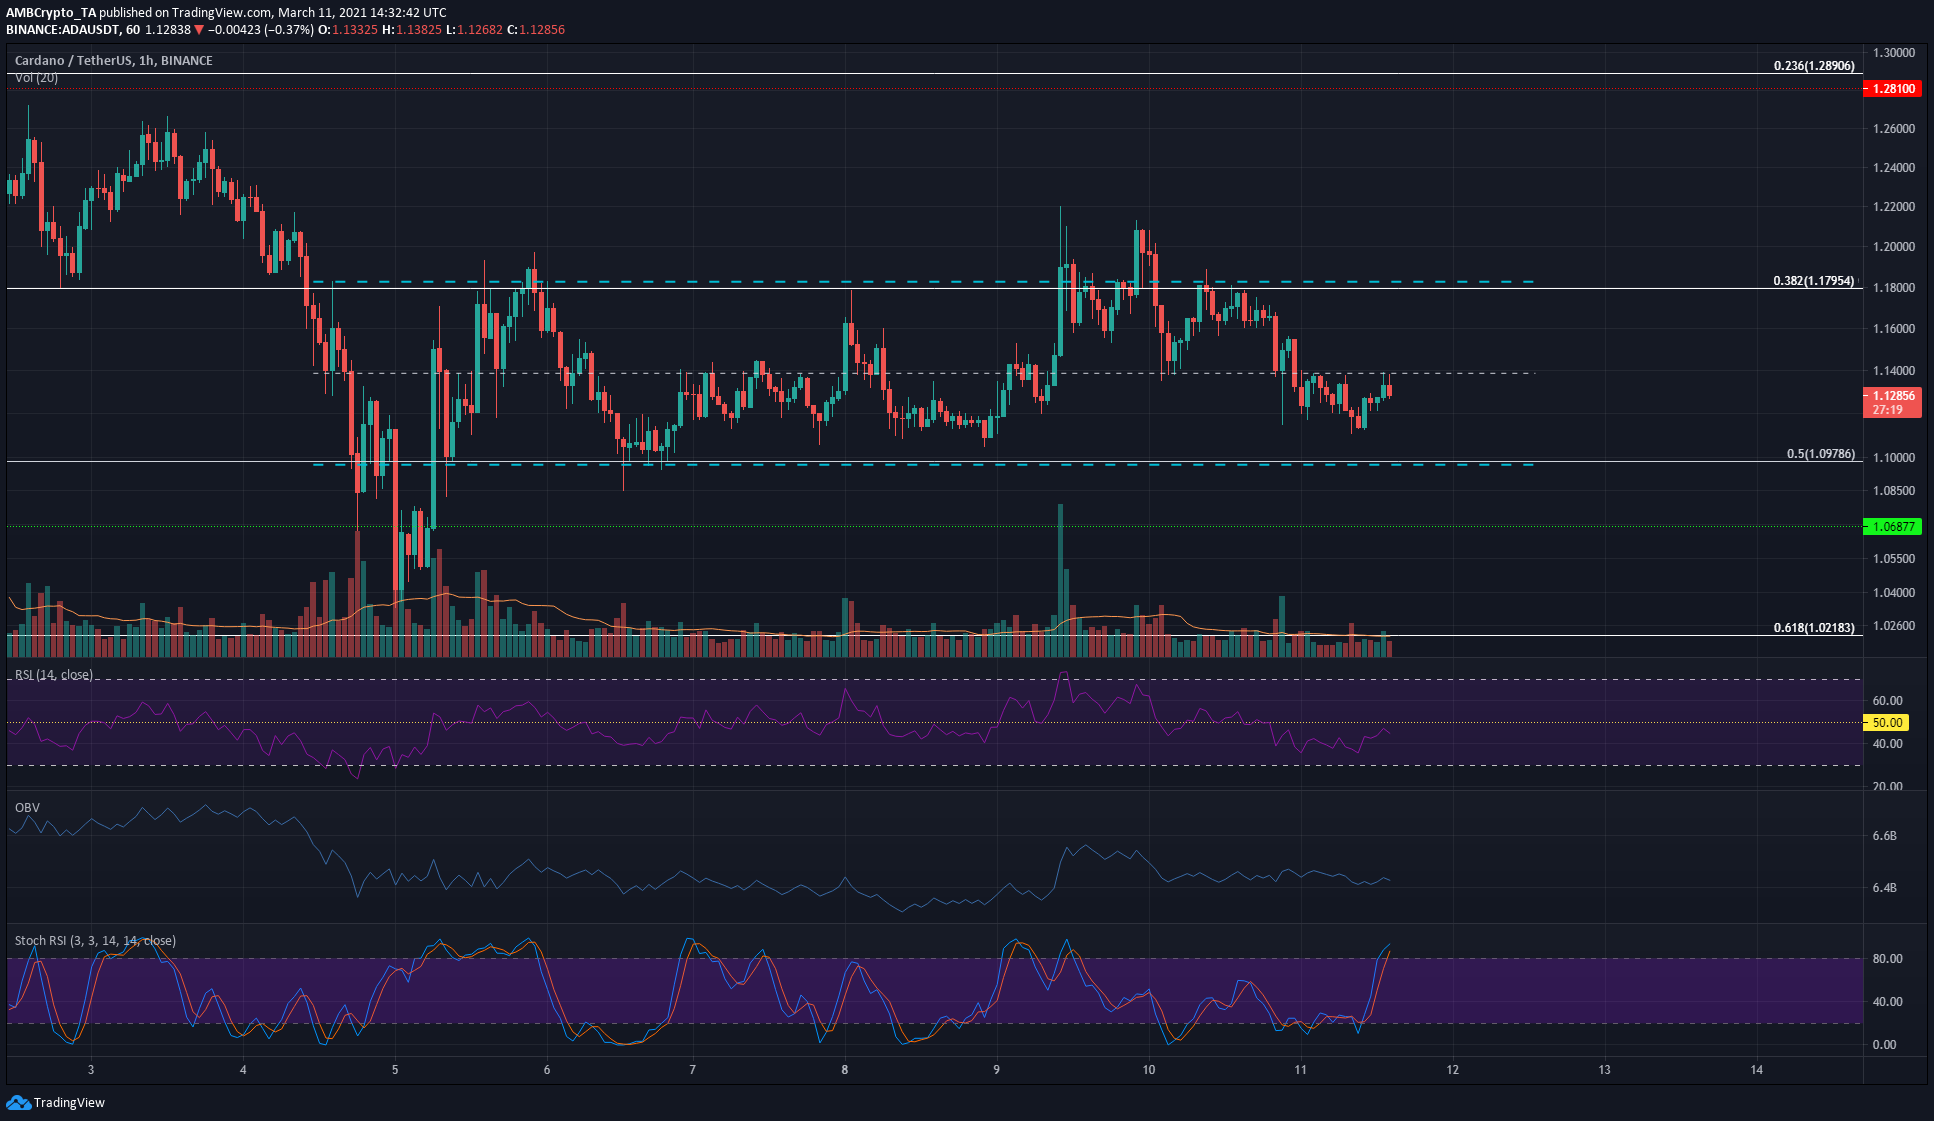
Over the past week, ADA formed a range whose upper and lower boundaries were at $1.179 and $1.098. There was a significant drop to $1.04 early on, but almost immediately ADA recovered to retest the range highs.
Mid-range mark of $1.14 appeared to act as support and resistance on multiple occasions, reaffirming the notion of a short-term range formation.
The past few hours saw ADA sink beneath this value and retest it as resistance; momentum was bearish and ADA looked ready to see a dip back to $1.09.
Reasoning
RSI dropped beneath neutral 50 and stayed beneath, denoting a bearish trend in progress. Stochastic RSI on the hourly was also in the overbought territory.
On the OBV, the past couple of days showed an equilibrium between buyers and sellers. Going back a week, OBV did not note any strong trend or spike in either direction, showing no hint yet of a breakout or breakdown.
Conclusion
Within a range, its mid-point is the most important level, and losing this level to the bears is likely to see ADA drop to the range lows at $1.09. The $1.11-$1.123 region has also seen some demand over the past few days, making these two areas potential buying opportunities.


