Cardano rallies to $0.56, but here’s why a reversal is likely

- Cardano has a bullish market structure on the 12-hour chart.
- The lack of buying pressure suggested that a bearish reversal was likely over the coming days.
Cardano [ADA] rallied by 19.16% from the 7th to the 11th of February. Since then, the bullish price action has stalled as the buyers ran into a thick clump of resistance. Despite a bullish Bitcoin [BTC], the buying volume behind ADA has not kept pace.
A recent AMBCrypto analysis piece noted that the $0.54-$0.56 region was estimated to have a significant amount of liquidation levels. Combined with factors from the price action, a bearish reversal appeared possible.
The confluence of the FVG and order block
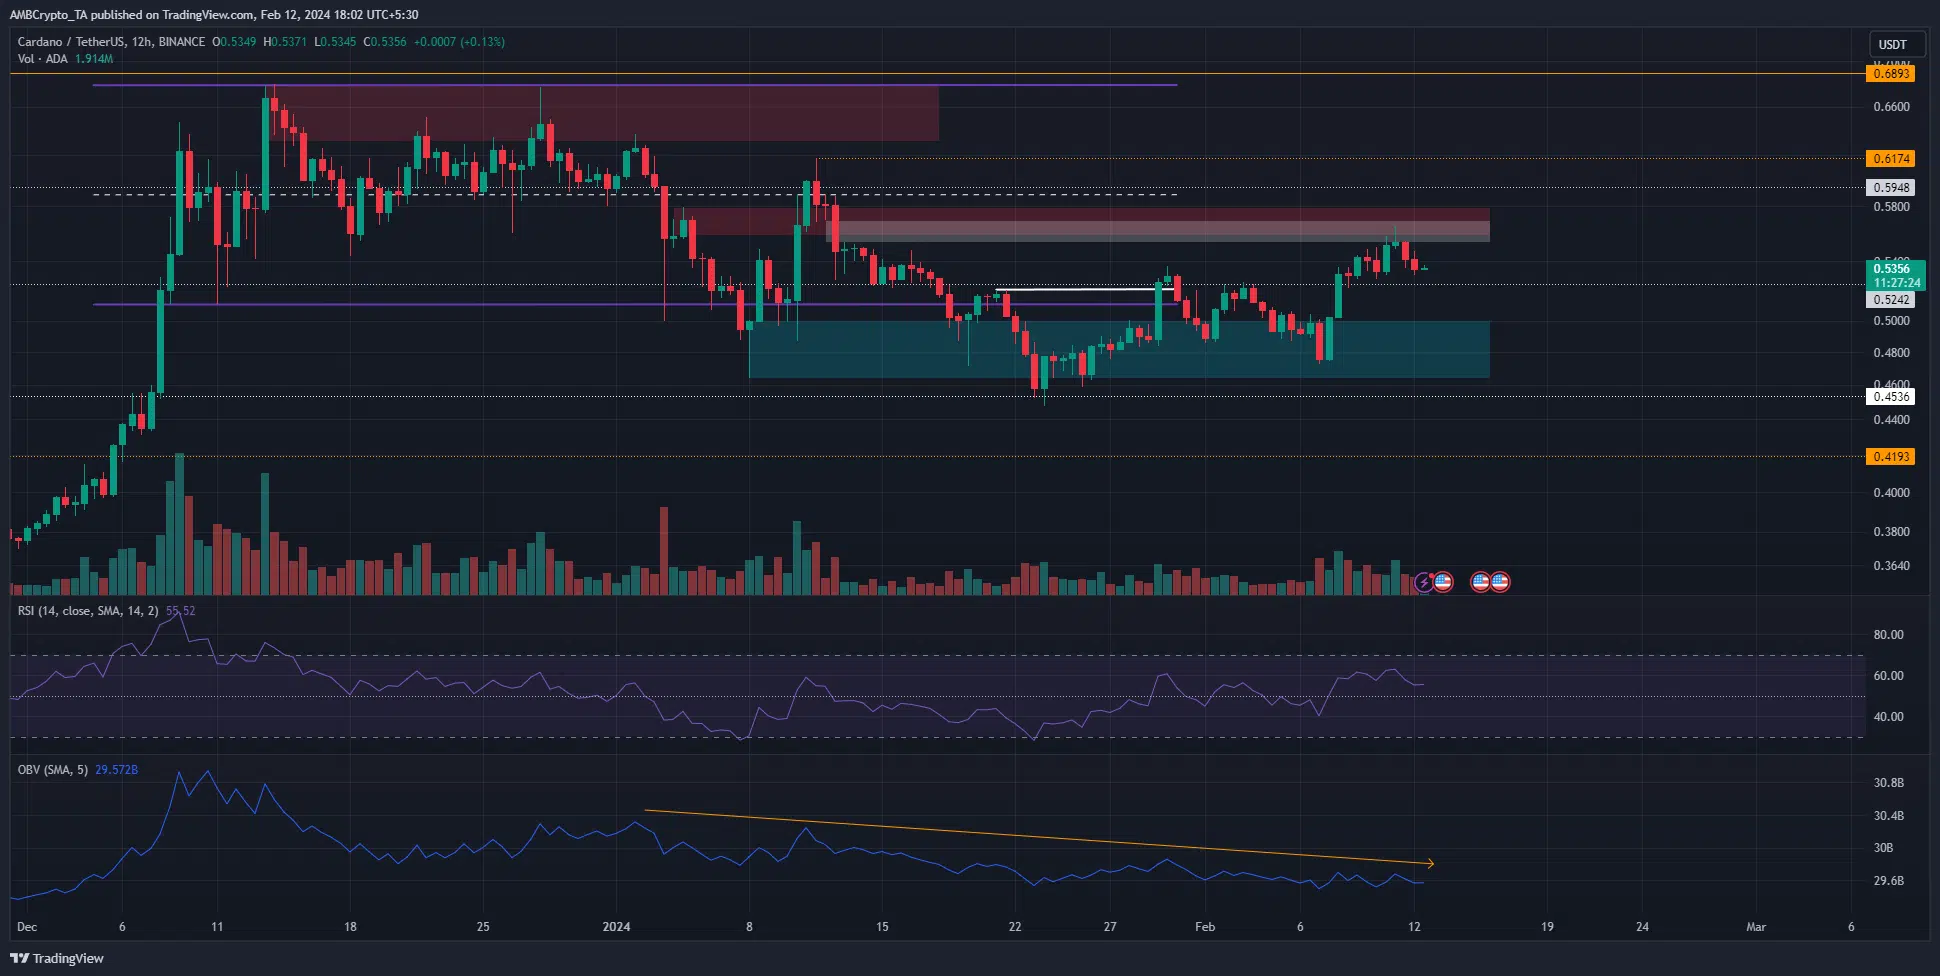
On the 12-hour chart, Cardano has a bullish market structure. This flip was achieved earlier this month when prices rallied past $0.5205. However, the 12-hour bearish order block (red box) at the $0.56 region came alongside the presence of a fair value gap (white box) at $0.55.
The RSI was moving above neutral 50 and agreed with the bullish market structure. Momentum pointed upward, but the OBV has been in a steady downtrend throughout 2024. This meant that even though ADA defended the $0.45 support zone, buying pressure steadily weakened.
A move past $0.578 would be necessary to signal that the bulls could take Cardano to $0.7. Until that scenario unfolds, traders could look to make profits going short on ADA, targeting the $0.48 support zone. Cardano investors can calculate their profits here.
Gauging the market sentiment in the short-term

Source: Coinalyze
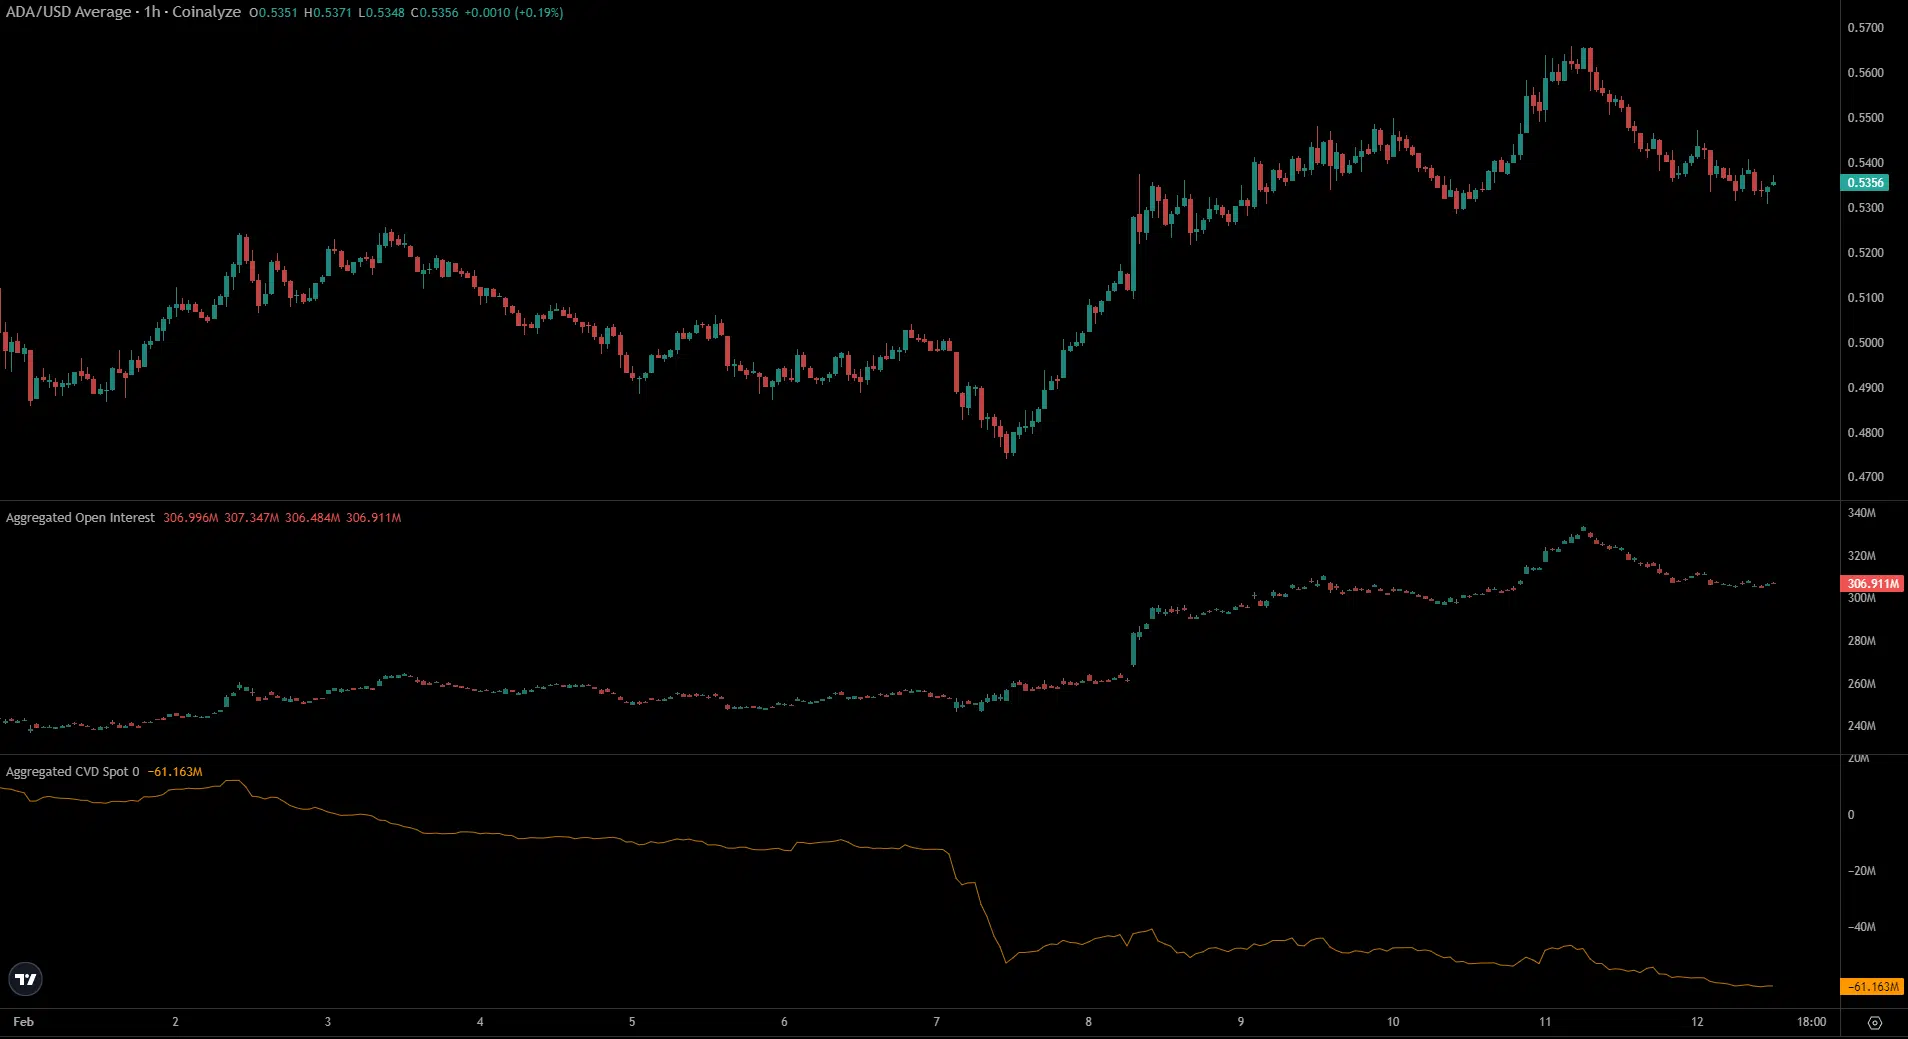
The Open Interest chart trended upward from the 7th to the 11th, alongside prices. This showed speculators were willing to go long. But that changed over the past 24 hours. On the other hand, the spot CVD chart was unable to establish an uptrend.
Like the OBV, the spot buying activity was also muted on the lower timeframes. The lack of demand meant a rejection from the $0.55 region was likely underway. Another foray into the $0.48 zone is a likelihood.
Disclaimer: The information presented does not constitute financial, investment, trading, or other types of advice and is solely the writer’s opinion.


