Cardano, Shiba Inu, EOS Price Analysis: 10 November

As the broader market displayed an increased bullish influence over the past few days, altcoins like Cardano and EOS performed well. They reached their four and seven week highs, respectively, whereas their near-term technicals suggest a decreasing buying momentum.
On the other hand, Shiba Inu registered a decline on its daily charts and flashed a preference for the bears.
Cardano (ADA)
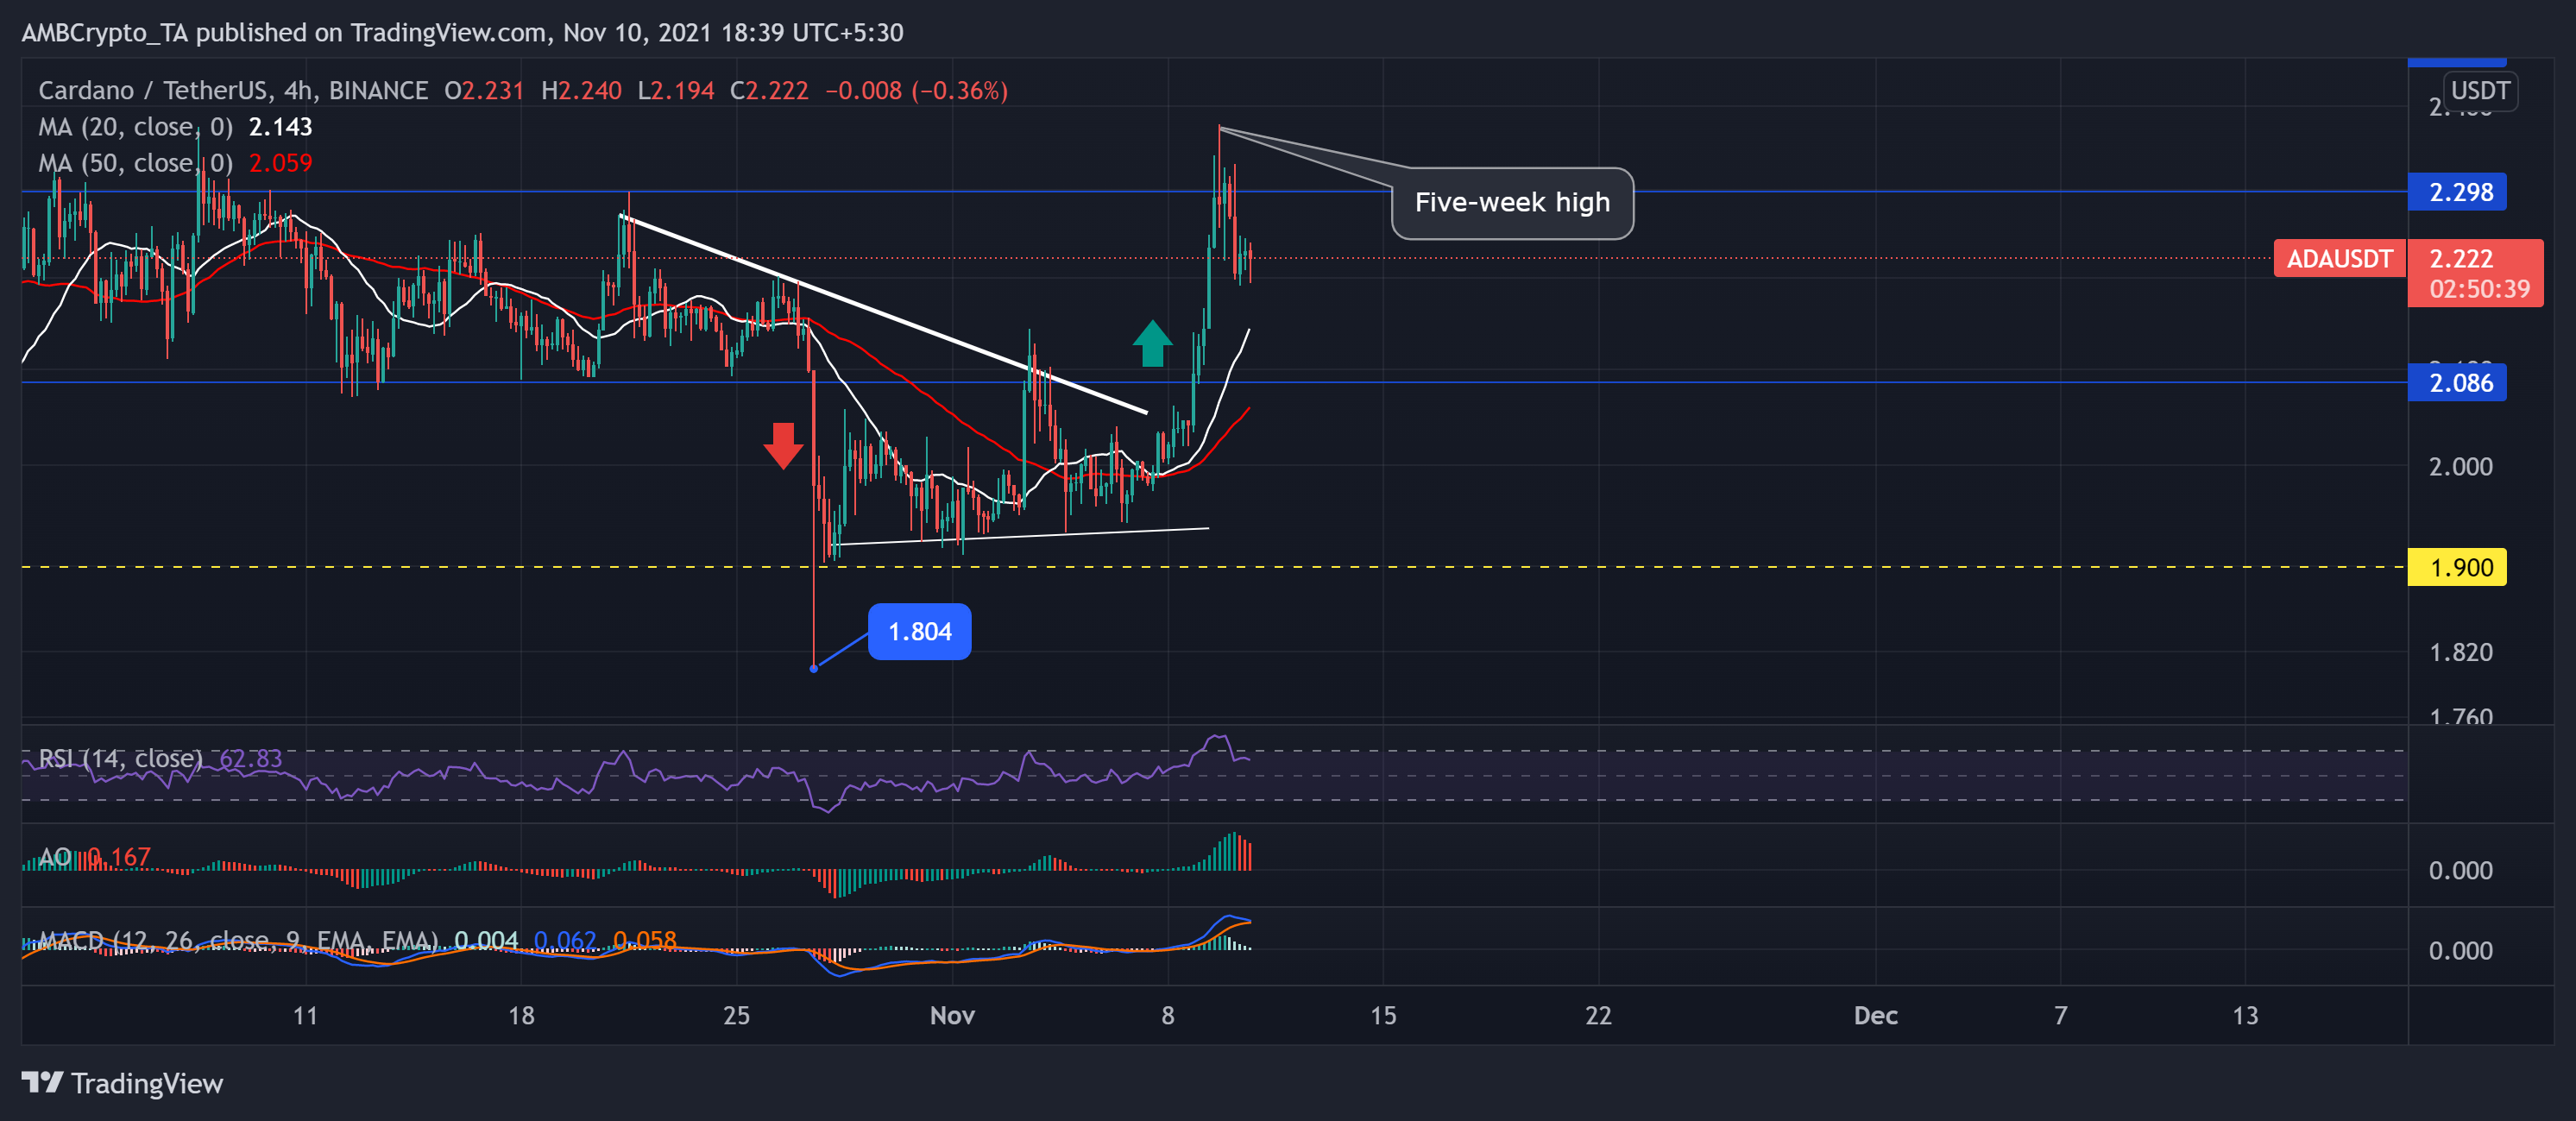
Since late September, ADA oscillated sideways and consolidated within the bounds of its immediate resistance and support points. As the bears exerted immense pressure, they breached its support of $2.086 on 27 October. Consequently, the crypto touched its eleven-week low at $1.804.
Until 8 November, ADA did not perform well while it got flipped by Solana. However, ADA bulls demonstrated vigor as the price rallied by over 30% to poke its one-month high on 9 November. Subsequently, the price action witnessed a retracement as bears countered the increasing buying strength.
As a consequence, the near-term technicals slightly inclined towards the bearish side. At press time, ADA traded at $2.22 after noting a nearly 3% loss in 24 hours. The Relative Strength Index saw a 20 point decline, depicting a shrinking bullish influence.
Further, the Awesome Oscillator (AO) and MACD correlated with the RSI’s interpretation. Unless the ADA bulls re-demonstrate their force, price action seemed to consolidate in the coming days.
Shiba Inu (SHIB)
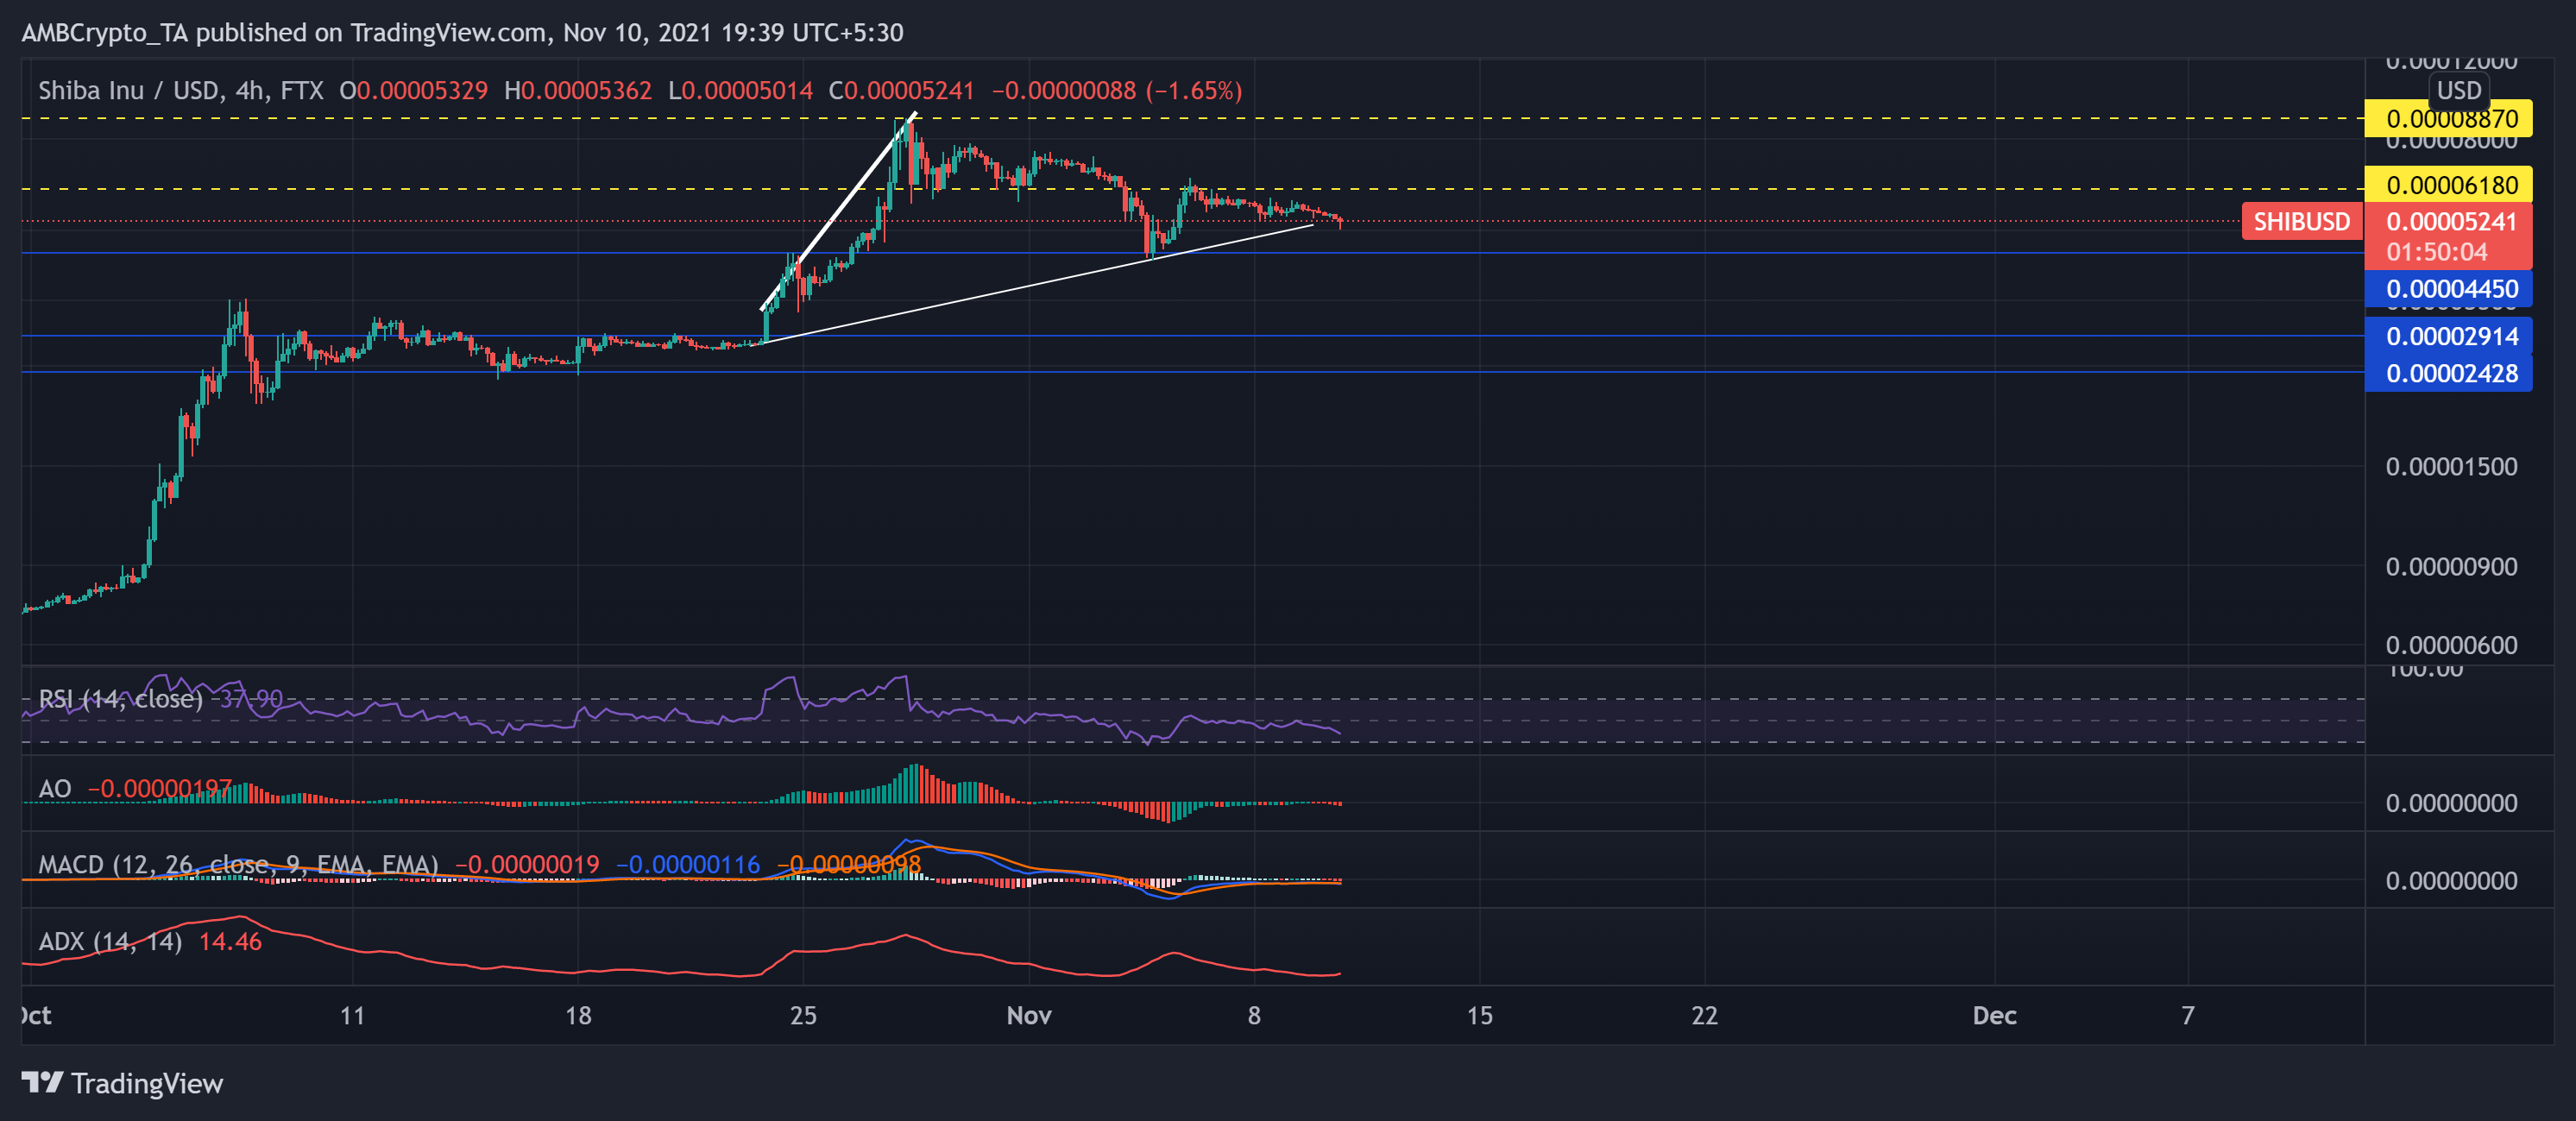
The meme crypto undertook a bullish price action since 23 October. Consequently, it reached its ATH on 28 October at $0.0000887, after which it saw a pullback. Since then, the price moved in a downtrend as the token noted a nearly 39% decline (13-day).
SHIB bears visibly exerted sustained pressure by breaching the resistance point and found support at $0.0000445. The token registered a nearly 7.4% decline in 24 hours as near-term technicals preferred the bears. At press time, SHIB traded at $0.00005241.
Over the past day, the RSI plunged from the midline toward the oversold territory at the 37-mark. Also, the AO flashed red signals, reiterating the increased selling power. Additionally, the MACD showed a preference for the sellers as well. However, the ADX level displayed a weak directional trend.
EOS
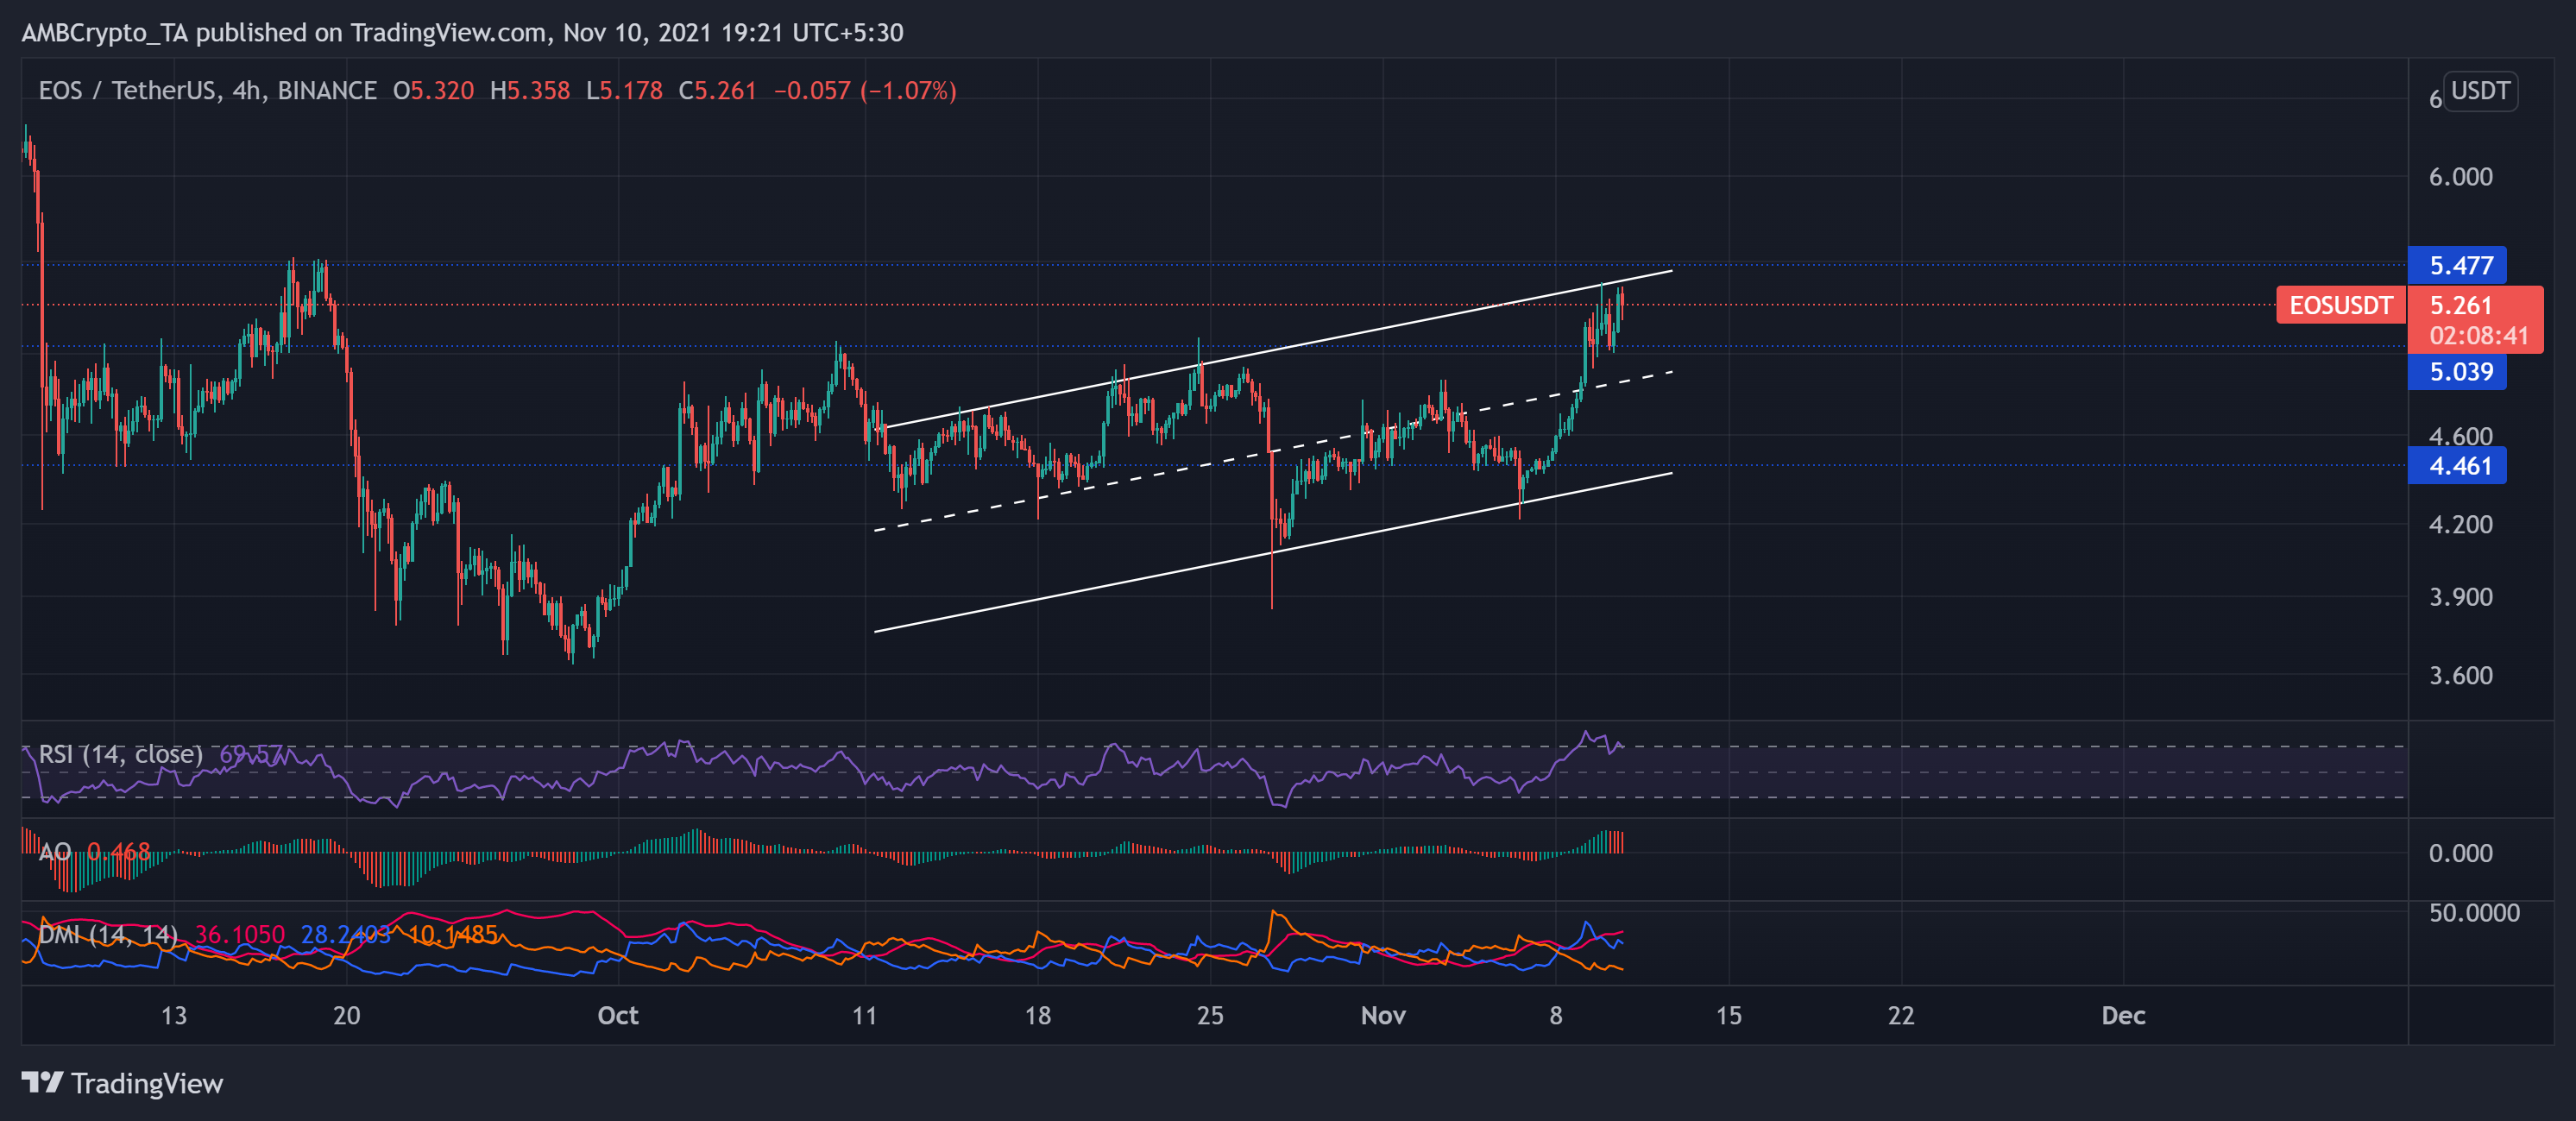
Since 11 October, the EOS price action undertook a bullish trajectory as the price moved between the two parallel lines heading north. The digital currency noted a 15.2% and 12.2% monthly and weekly ROI, respectively. Consequently, EOS reached its seven-week high on 9 November and retreated between the parallel lines.
The altcoin saw a 3.1% increase in 24 hours while the technicals hinted at decreasing buying strength in the near term. At press time, EOS traded at $5.261.
The RSI plunged by 11 points and looked south, indicating decreasing buying strength in the near term. Moreover, the DMI depicted buying power but pointed at possible ease in bullish momentum as the DI line looked downwards. Additionally, AO flashed red signals and harmonized with previous observations.


