Cardano, Synthetix, Zcash Price Analysis: 11 June

While a move above Cardano’s ascending triangle could see the price head back towards $2, its technicals suggested a break in the opposite direction. Synthetix was tipped to defend $8.65 from a breakdown and rise north from its up-channel. Finally, Zcash could keep itself grounded under its EMA Ribbons until the broader market recovers from its recent lows.
Cardano [ADA]

While Cardano’s short-term trajectory seemed rather bleak – candlesticks were below all 3 moving averages (20, 50, and 200 SMA), its long-term movement was expected to be bullish as per the formation of an ascending triangle. On the 4-hour timeframe, ADA formed a series of higher lows and tested the $1.85-resistance multiple times since the end of May. An ascending triangle appeared in the process – A pattern that usually sees a break to the upside.
Such an outcome would also see ADA touch $2 for the first time since the 19 May crypto-crash.
On the flip side, there were near equal chances of a breakdown according to its indicators. The OBV moved south after 16 May as selling pressure drove market prices. Even the RSI’s lower trajectory flashed warning signs in the market. A move below the lower trendline could drag ADA towards its next defense at $1.24.
Synthetix [SNX]
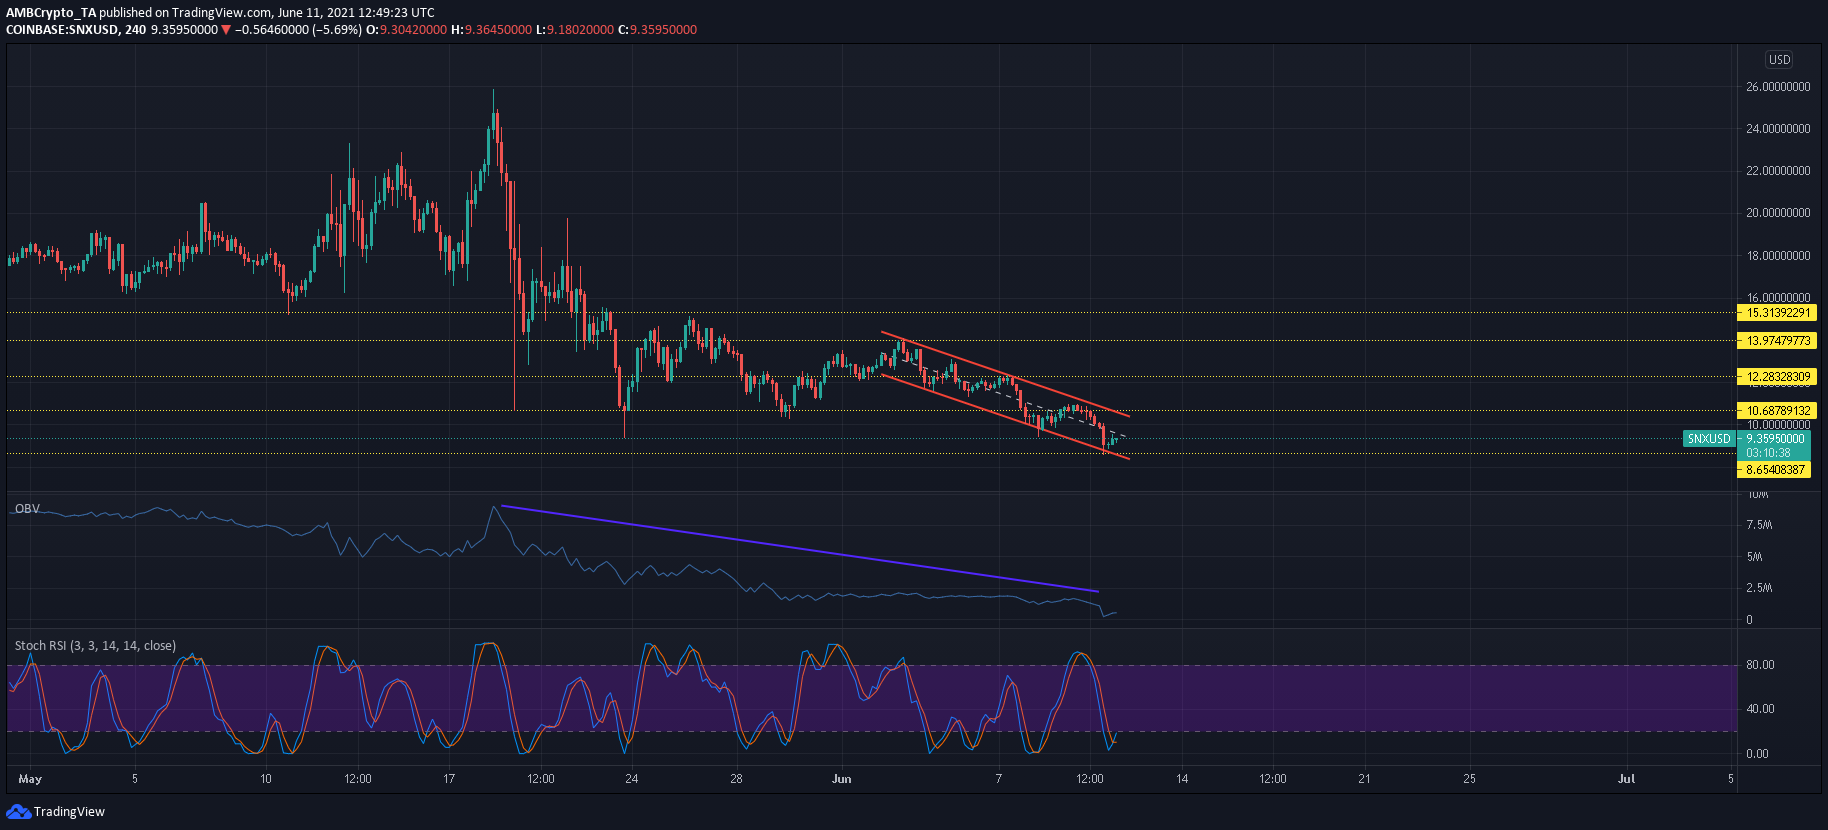
With further losses of 23% over the last seven days, Synthetix seemed to have borne the brunt of the market corrections on 19 May. Since the day, SNX has failed to maintain key levels on its 4-hour chart as bulls have had to grapple with constant selling pressure. The same was outlined by OBV’s downtrend. SNX eventually found a support line at $8.65 – A level last seen in January.
On the plus side, the formation of an up-channel injected some optimism in the market. A break above the upper trendline and $10.7-resistance could trigger a minor rally towards the $12-mark. The Stochastic RSI’s bullish crossover in the oversold zone suggested that SNX was up for a reversal and all eyes would be on its overhead resistance moving forward.
Zcash [ZEC]
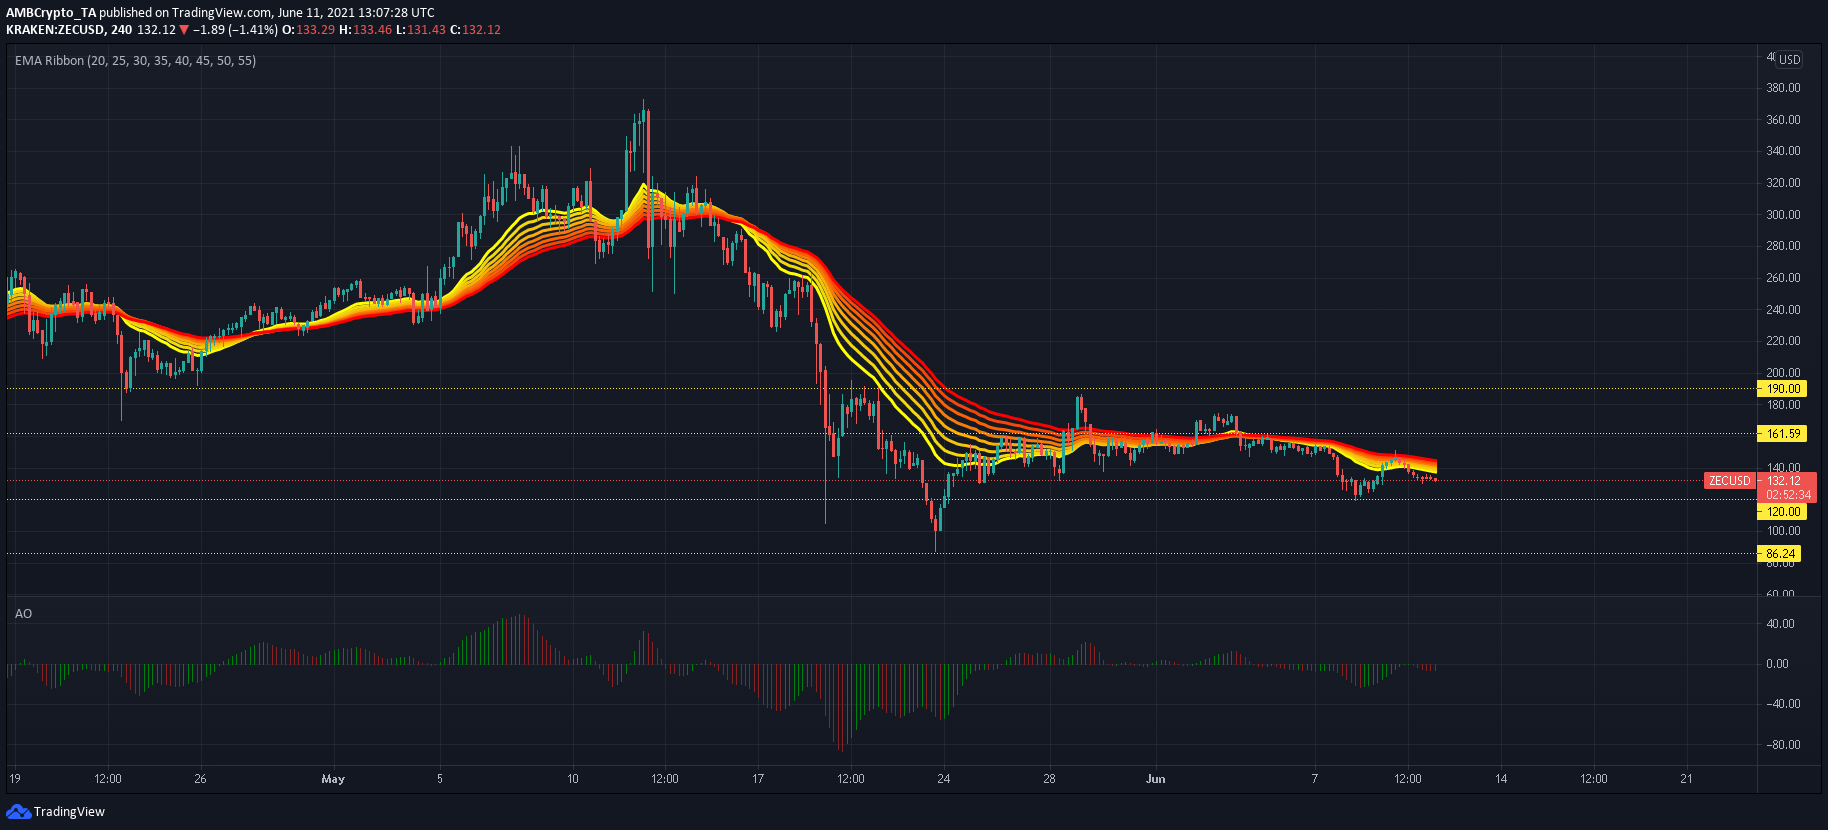
Historically, Zcash has shared a strong correlation with Bitcoin, and its movement since 19 May was a testament to that fact. Upwards price action in the BTC market has induced bullish sentiment in the ZEC market as well but gains have been limited at the strong resistance line of $190. When BTC retraced to $32,000 on 7 June, ZEC fell by nearly 20% but defended the $120-support level from an additional breakdown.
Needless to say, ZEC’s short-term trajectory heavily relied on the king coin’s path forward. Under extreme bearish conditions, its price could sink towards the demand zone between $85-$100. The constricted nature of ZEC’s EMA Ribbons suggested some sideways movement in a bear market. The bands could also function as resistance lines in case of an attempted breakout.
According to the Awesome Oscillator, bearish momentum was on the up.