Cardano, Tezos, VeChain Price Analysis: 12 February

Cardano highlighted an area at $0.86 to defend over the next few hours before it could make an attempt at $1 once more. Tezos climbed toward $4.25 and had the momentum to break past, while rejection would see it revisit $4. VeChain surged past $0.038 and targeted $0.046.
Cardano [ADA]
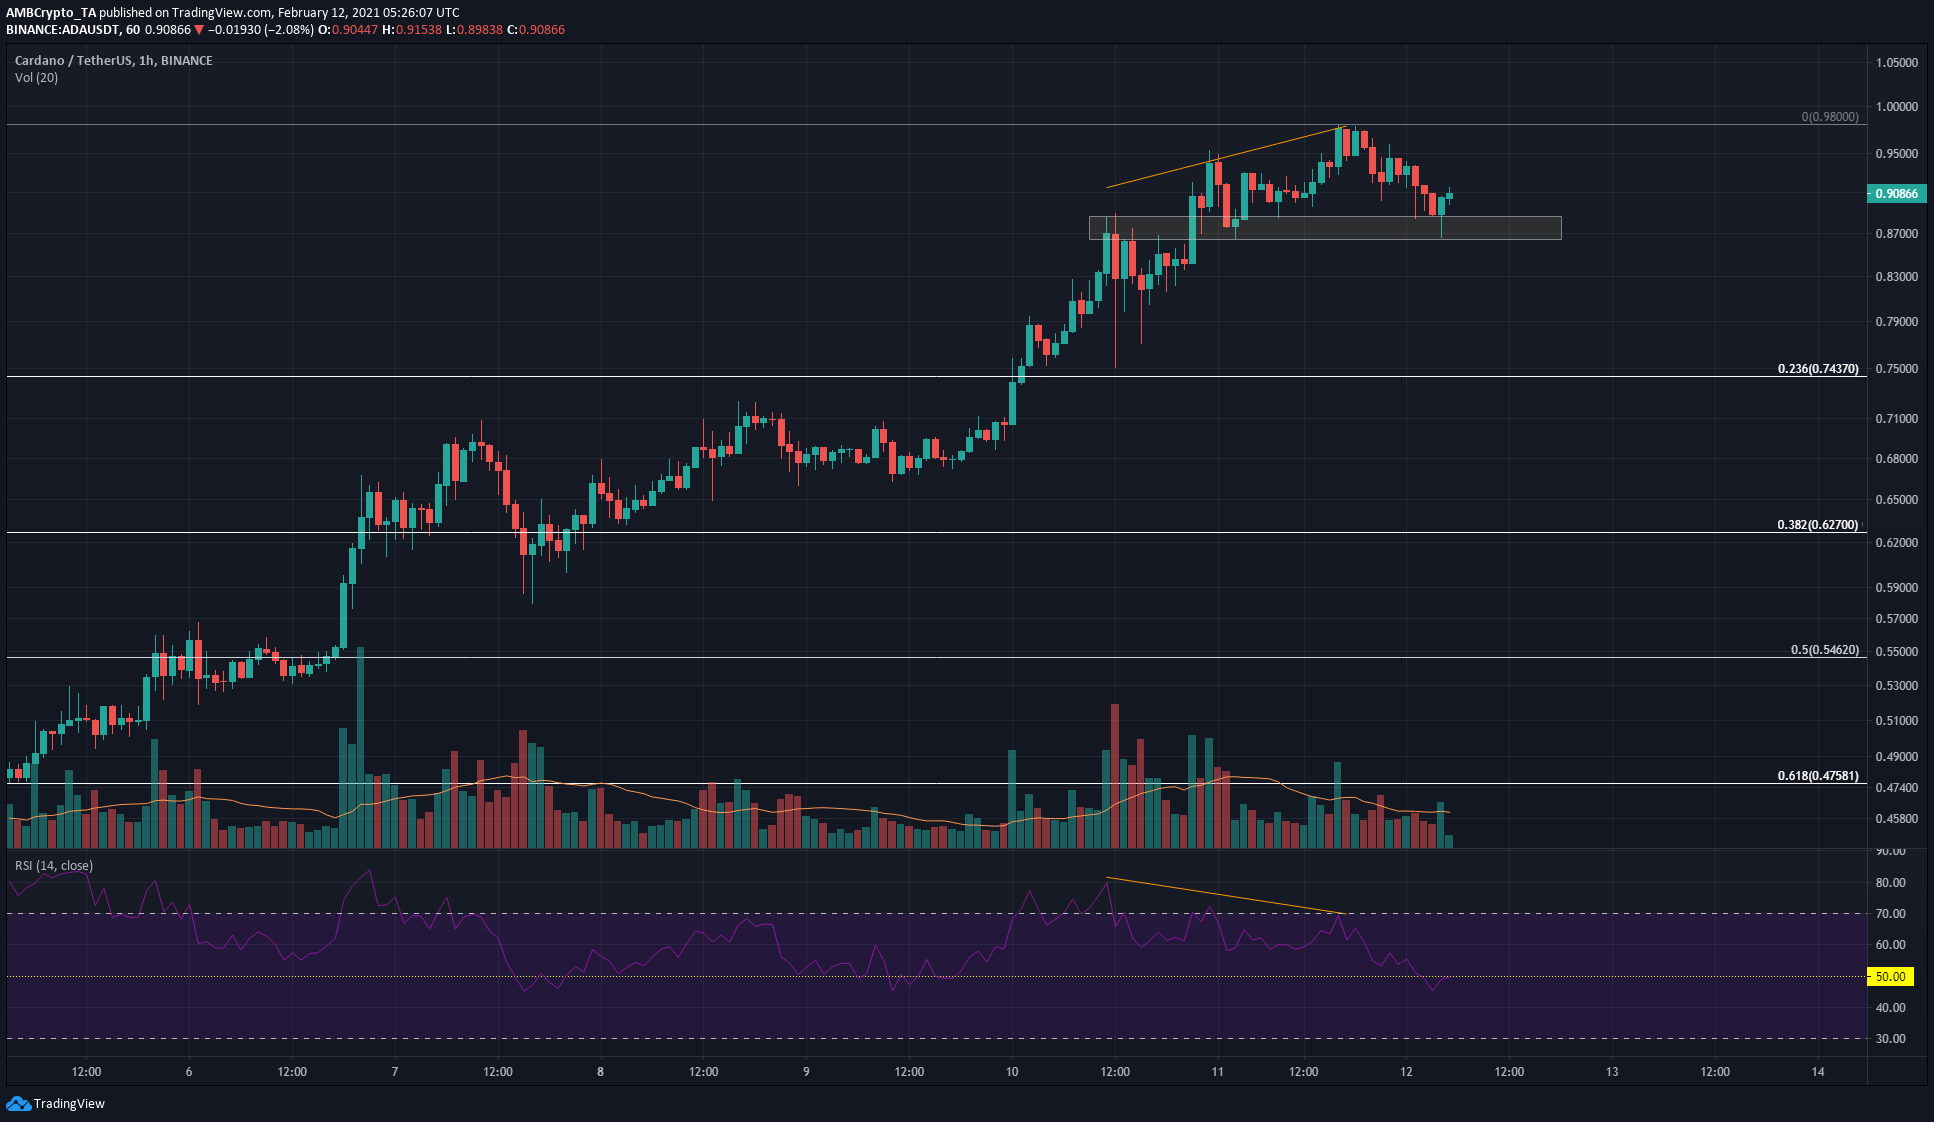
Although ADA showed a bearish divergence on the charts, the $0.86 region has held firm as a region of demand.
On the hourly chart, RSI dropped below neutral 50 to indicate bearish momentum. Trading volume was also falling even as the buyers drove the price back above the highlighted region.
Hence, in the short-term, ADA showed signs of imminent sell pressure as it neared the $0.95-$1 area of supply. A trading session close below $0.86 would point toward a pullback for ADA, with $0.815 and the 23.6% retracement level at $0.74 expected to serve as support.
Tezos [XTZ]
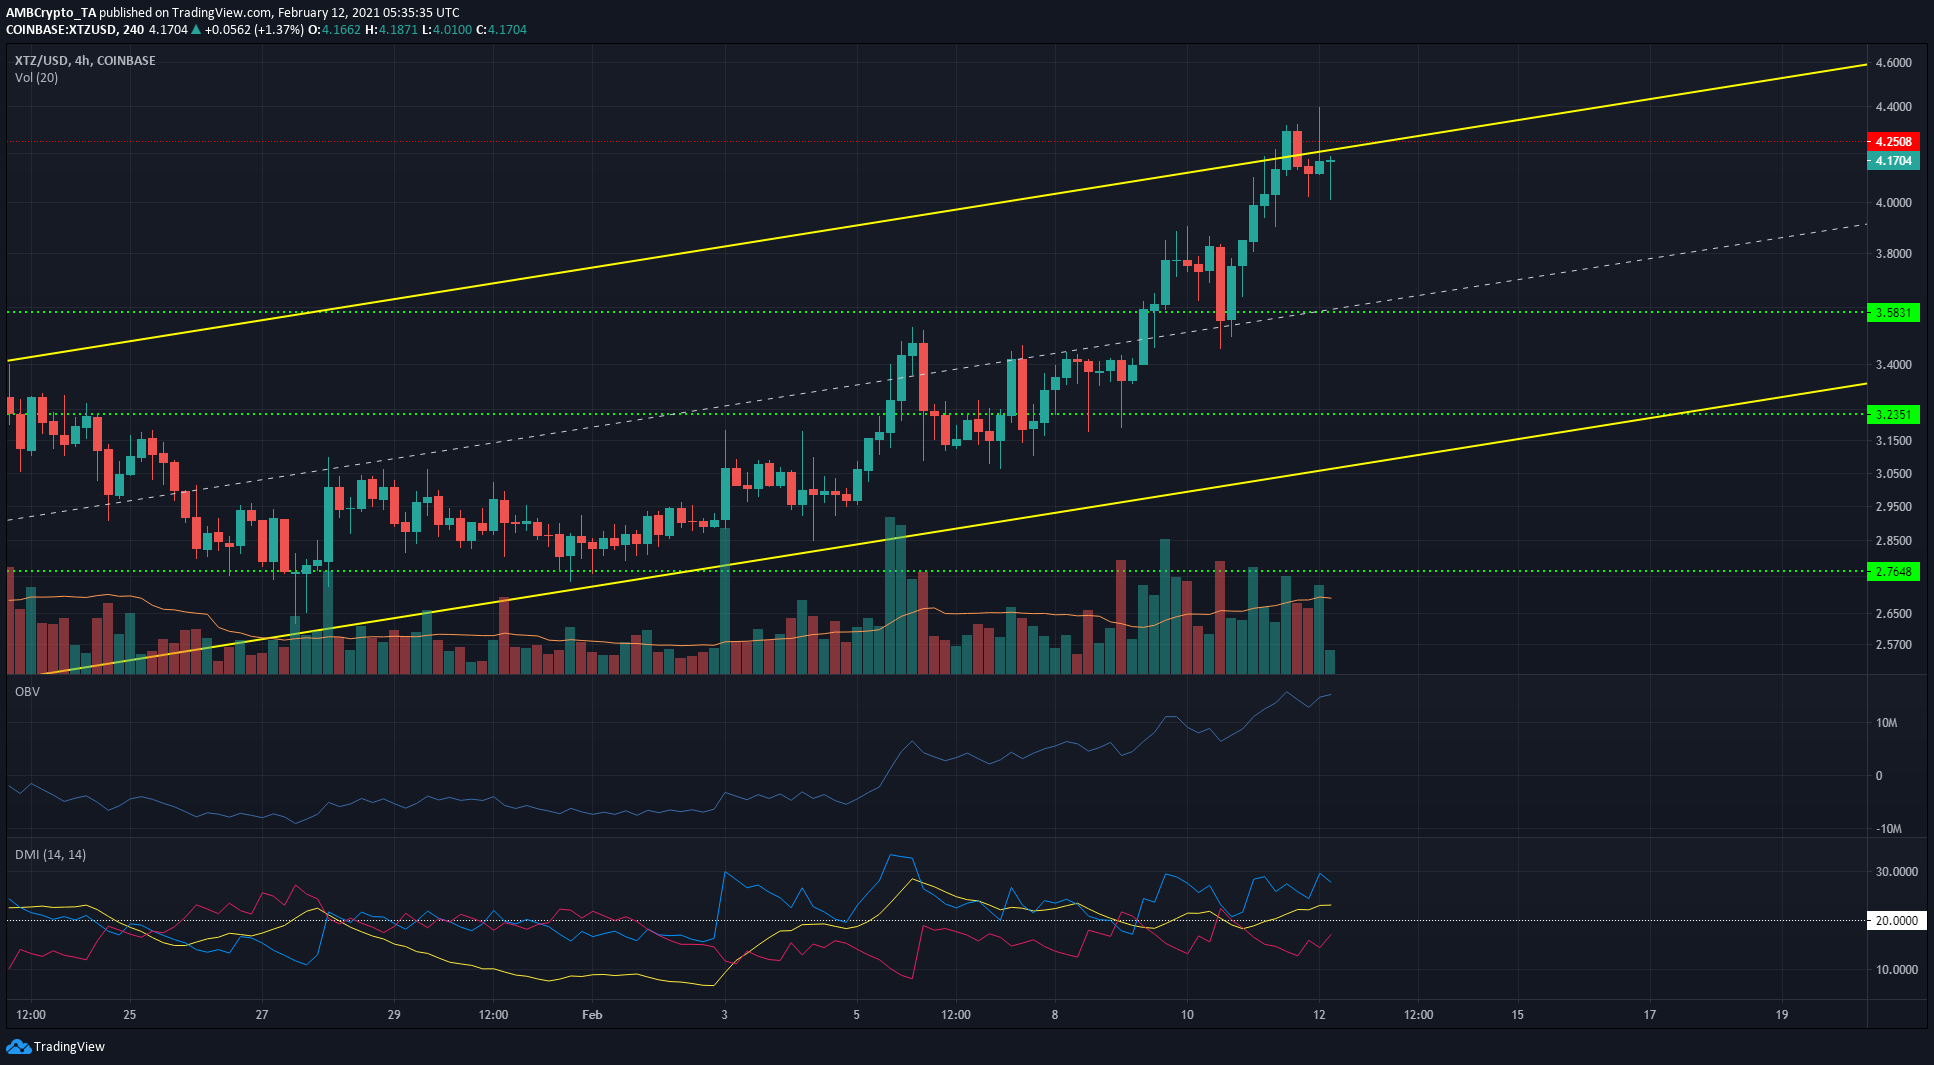
Tezos looked strongly bullish and could break out to the upside of the rising channel and above the $4.25 level of resistance. Conversely, a second rejection at resistance would see XTZ retrace gains and move to the $3.8 mark.
The reaction of the price over the next few hours is important. Momentum was on the side of the bulls, and buying volume was higher than selling volume on the OBV.
The DMI showed a strong uptrend in progress, but the reaction of XTZ at this level of resistance is important. A breakout past $4.25-$4.3 and a retest of the same region would confirm a move to the upside, while a drop beneath $4 would see XTZ drop further to $3.8.
VeChain [VET]
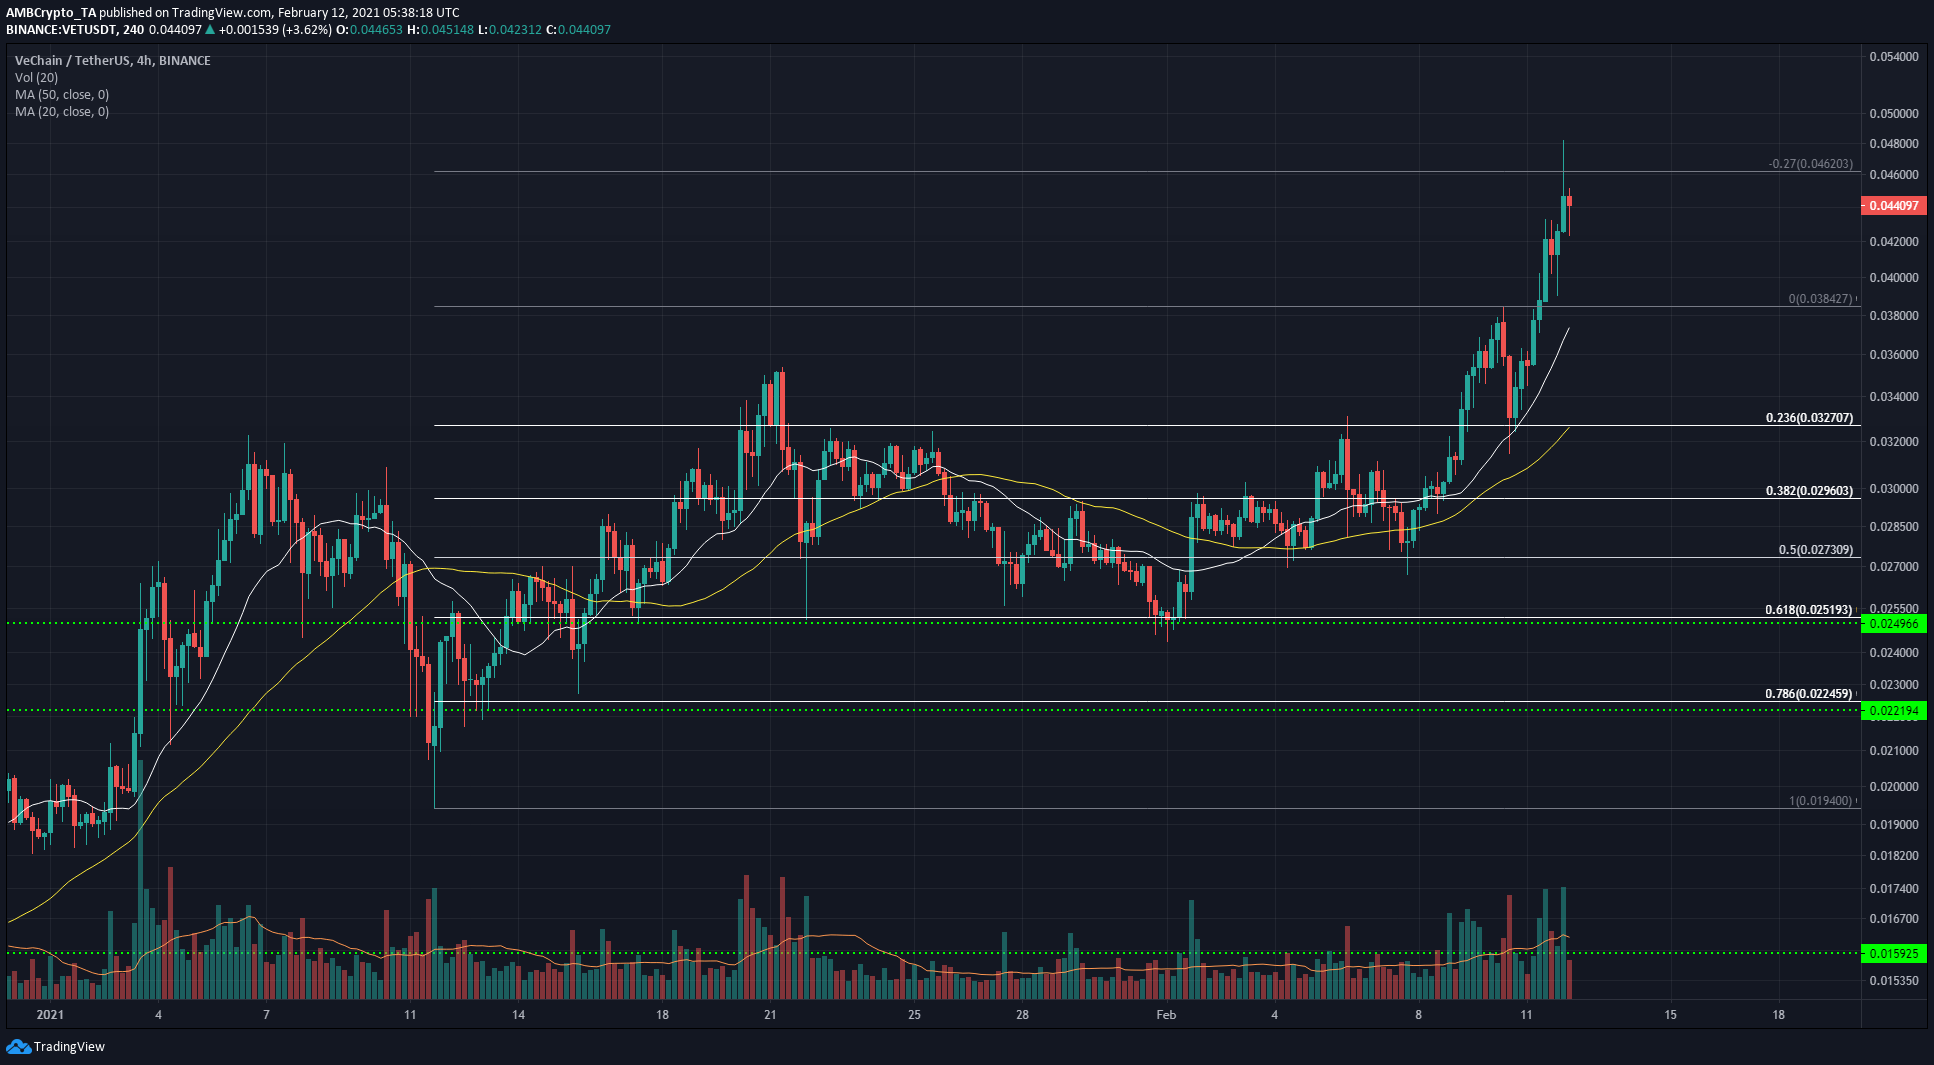
VeChain had strong bullish momentum. The 20-period SMA (white) struggled to keep pace with the price, while the 50 SMA (yellow) lagged further behind.
Trading volume was also high as the price climbed past $0.038.
The 27% extension of the move up from $0.0194 to $0.038 lies at $0.0462, a mark that bulls would attempt to test and ascend past once more, having faced selling pressure during its previous attempt.