Cardano: The cause for its current downtrend may be surprising
While it is usually assumed that an asset’s price dictates the market’s sentiment, some interesting observations challenge that notion. These metrics show how neither the price action nor the potential of the coin’s network dictates the coin’s performance, it’s the holders.
Cardano’s fall due to sentiment?
It indeed is. Call it FUD or the concern among investors related to Bitcoin‘s price action, this seemed to be determining how ADA moves. Social sentiment commanded its volume instead of the price. When charted on the 30-day Simple Moving Averages, it becomes apparent that sentiment was driving the inflows and outflows of this altcoin.
The reason why volume is the focus is that when the 30-day SMA is placed on the price action, it does not fit the pattern.

Whereas, Social Volumes, Average Sentiment (Reddit) & Total Positive Sentiment all match the pattern that volume registered. A closer look reveals the same, although there was some difference in their movements at the beginning of the year. But the difference has since become almost negligible.
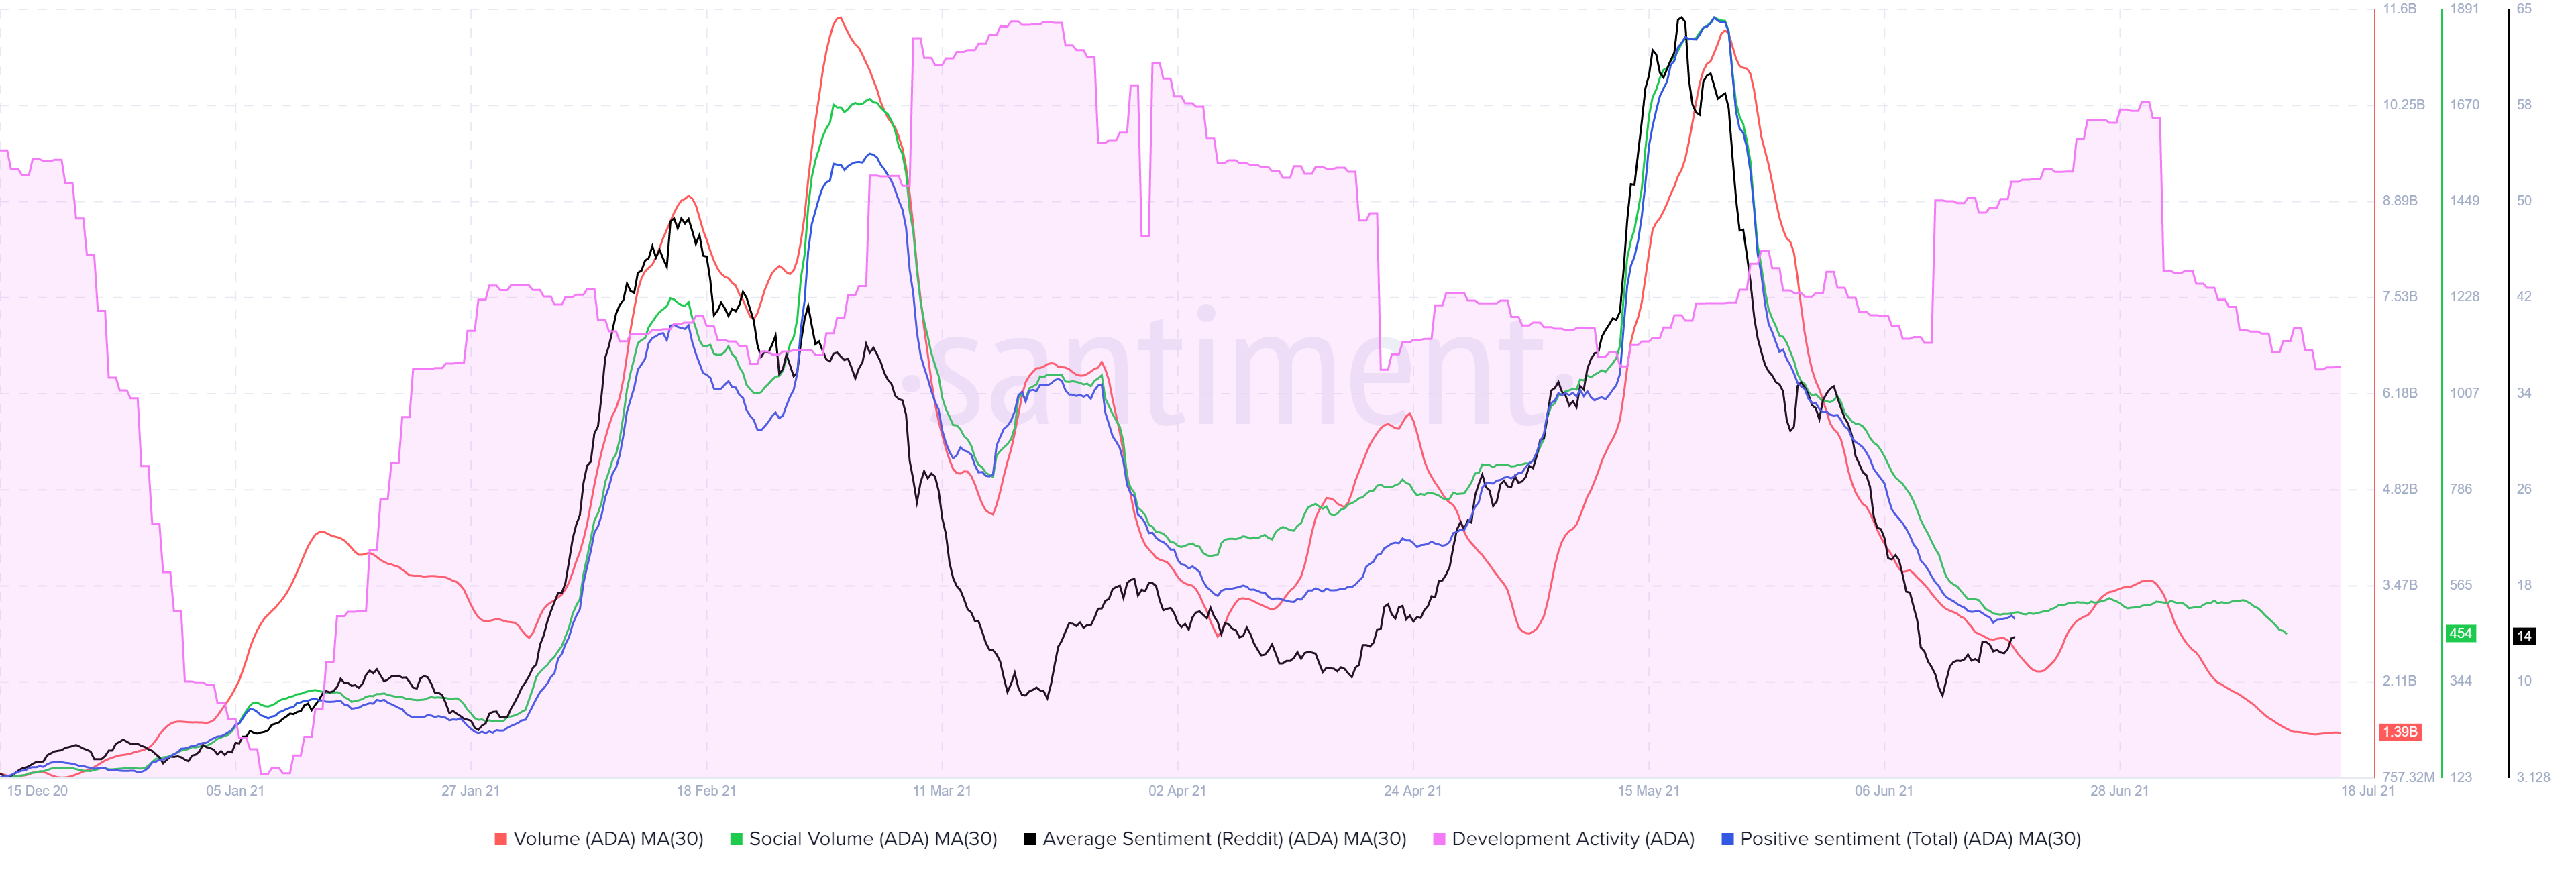
This is so because the April-May hike and the volumes during the following time period of the crash, and social sentiment have a suspicious correlation. Somehow even before the volumes rose, all three social metrics were already moving up. While the sentiment was at its ATH, volumes were still following, with a difference of 24 hours. Similarly, when these metrics fell quickly, so did the volumes.
The price action once again had nothing to do with this since even before ATHs, these metrics were following Cardano’s volumes. Their movement only became close-knit post the hike.
What about the network?
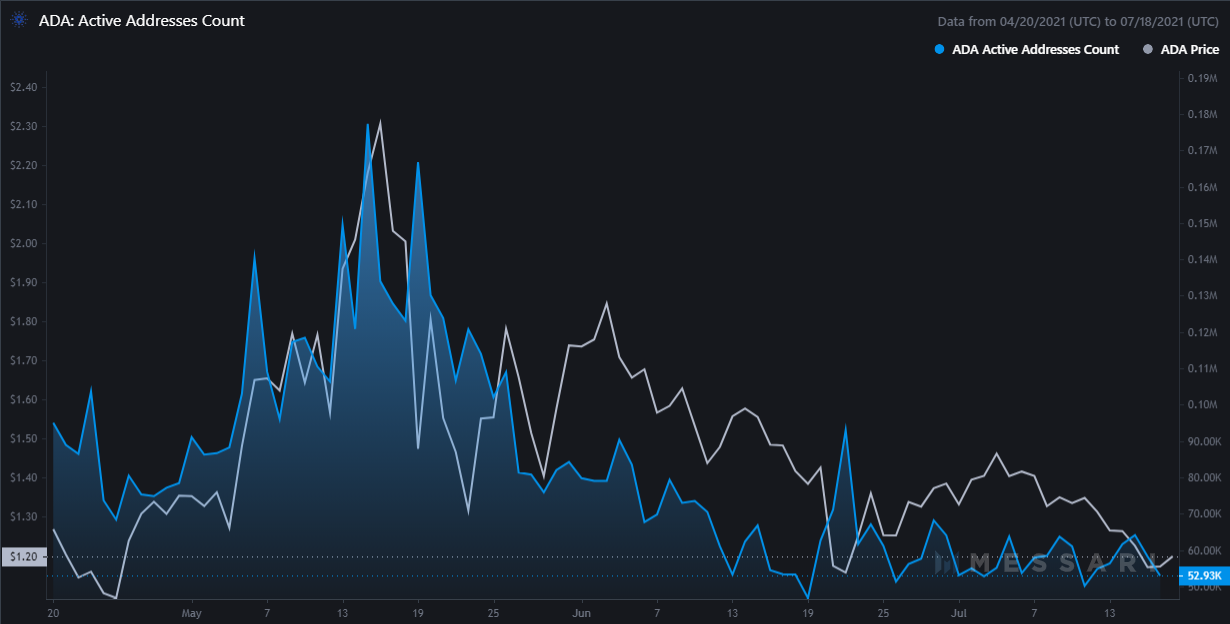
The network surprisingly has nothing to do with the ADA’s market movement either. Despite developer activity being at its lowest of 2021 in May, the volumes were still high. Similarly, despite strong development activity at this point, price and volumes were both down. Additionally, because of this, transaction volumes have been down significantly and so were the active addresses.
Both these metrics are in a way the sum of trading volumes and social sentiment, and this is why they were low as well.
So if you are a Cardano investor and have been looking for an answer as to why ADA is performing terribly, one of the reasons can be attributed to investor sentiment.