Cardano, Uniswap, Chainlink Price Analysis: 16 May

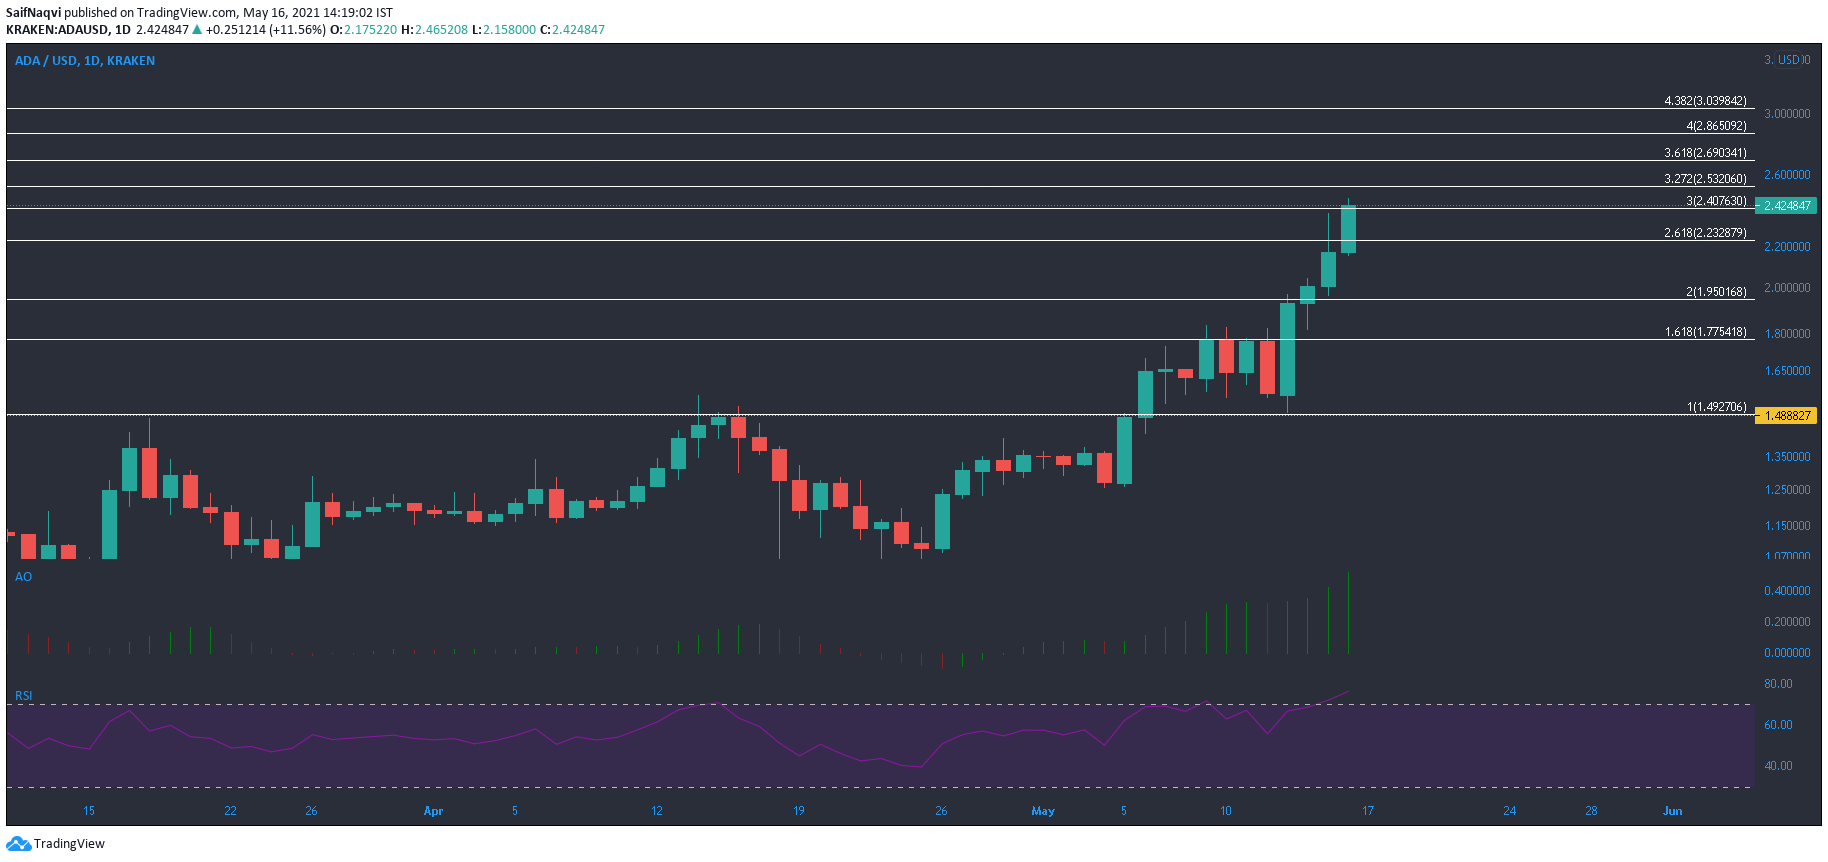
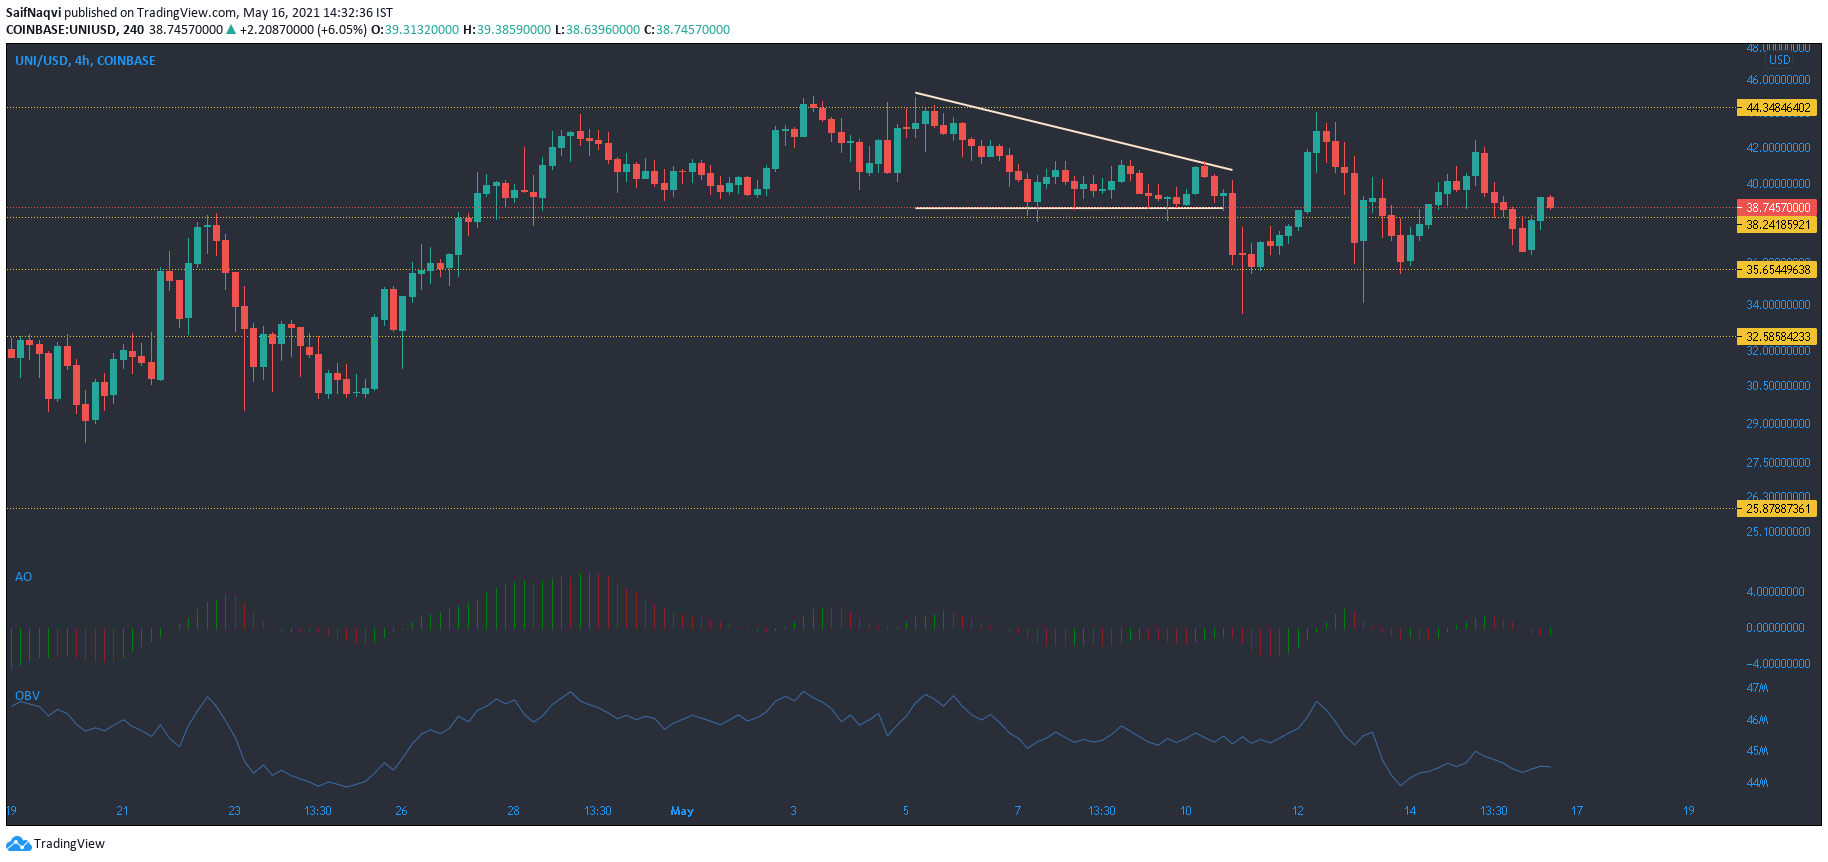
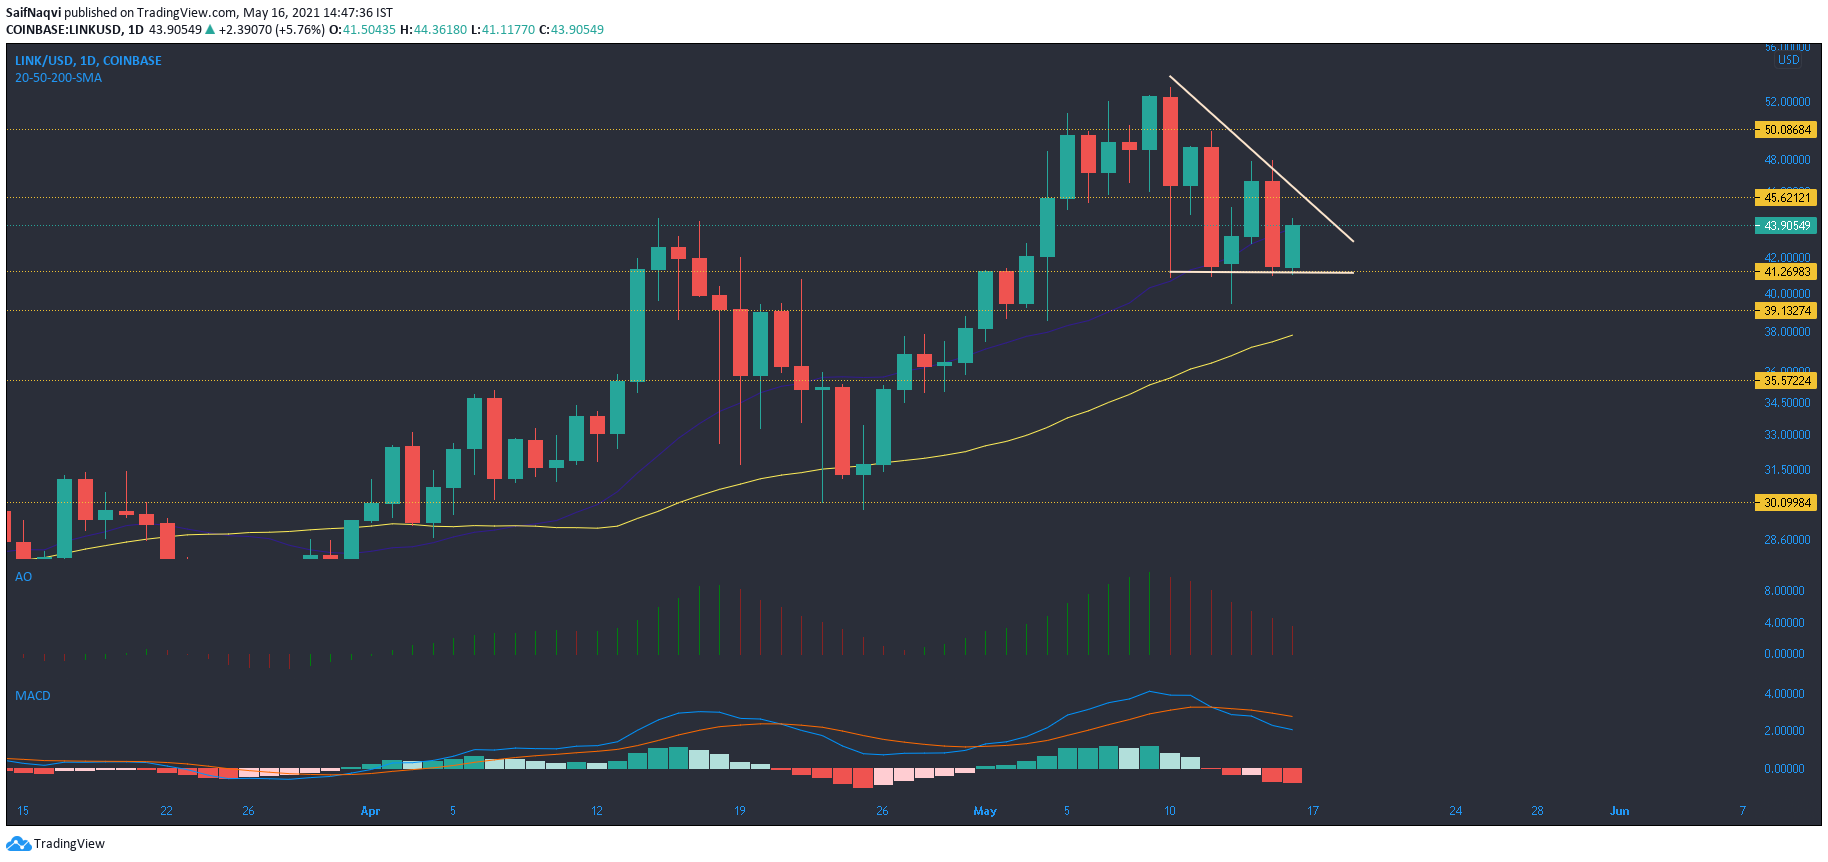
Cardano introduced some target levels at $2.53 and $2.69 via the Fibonacci Extension tool. Uniswap needed to garner bullish strength for a break above $43-$45 resistance. Lastly, a descending triangle breakdown on Chainlink could see a 7.5% retracement towards its 50-SMA
Cardano [ADA]

Source: ADA/USD, TradingView
If buyers were looking to make profits on large-cap alts during the recent turbulent broader market, Cardano was a must inclusion in every portfolio. Weekly gains of 36% were the highest among the top 10 coins by market cap and underlined ADA’s independence from broader market sentiment. Fibonacci Extension tool was used to identify potential target points for the current rally. The 372.2% and $361.8% extension levels stood at $2.53 and $2.69, respectively. With buying pressure still on the rise according to Awesome Oscillator, ADA made a strong case for an extended rally.
In case of pullbacks, these extension levels can also act as support lines. RSI’s overbought territory indicated the need for stabilization and a dip in volumes could mean some southbound action. Nevertheless, key factors could allow ADA to sustain higher levels moving forward.
Uniswap [UNI]

Source: UNI/USD, TradingView
A descending triangle breakdown showed losses of 8% from the bottom trendline, but buyers stepped in at $35.6-support. In fact, this support has been under the spotlight during recent dips and only reinforced the area as a buffer against extended losses. On the 4-hour timeframe, OBV’s sharp fall was an interesting development which explained why bulls have failed to topple $43-$45 resistance. Considering the dearth of constant buying pressure, Uniswap could trade between $44.4 and $35.6 over the coming days.
A breakout above $44.4 on high volumes would result in a bullish trend but the market was not yet ready for such a swing. Awesome Oscillator’s wavy trajectory suggested that neither side had been fully able to assert dominance.
Chainlink [LINK]

Source: LINK/USD, TradingView
While Chainlink did see losses over the last 24 hours, the bulls held on to $41.2-support – an important development. A descending triangle was prominent on the daily timeframe and a breakdown could see a sell-off between $35.7-39.1. Those hoping to trade on a breakdown can observe the 4-hour timeframe for more sensitive price action.
Awesome Oscillator registered a series of red bars as selling momentum dragged LINK from a high of $61.9 to a low of $39.7 during the present downtrend. MACD also confirmed a bearish presence in the market. To negate LINK’s pattern, buyers would need to target a rise above $45.6-resistance.


