
A rise above $1.68-resistance could see Cardano surge higher over the coming sessions. Uniswap headed towards $38.4-support in bear market conditions. Down the crypto ladder, Solana maintained a tight channel but the lack of buying pressure flashed red signals moving forward.
Cardano [ADA]

Source: ADA/USD, TradingView
After $1.41-resistance was overturned, a 20% surge saw Cardano touch a new record high at the $1.7-mark. However, some choppy movement was noted over the last few sessions and ADA made minor losses over the past 24-hours. The bars on Awesome Oscillator switched to red as momentum looked to switch sides. Conversely, the hourly timeframe noted positive momentum despite a dip in volumes.
RSI moved towards the overbought zone after a minor dip. If $1.68-resistance is toppled, ADA’s uptrend might see higher levels before an eventual correction. On the other hand, failure to break above this barrier could lead to some sideways movement before the next leg upwards. A spike in the 24-hour trading volumes could indicate another price swing.
Uniswap [UNI]
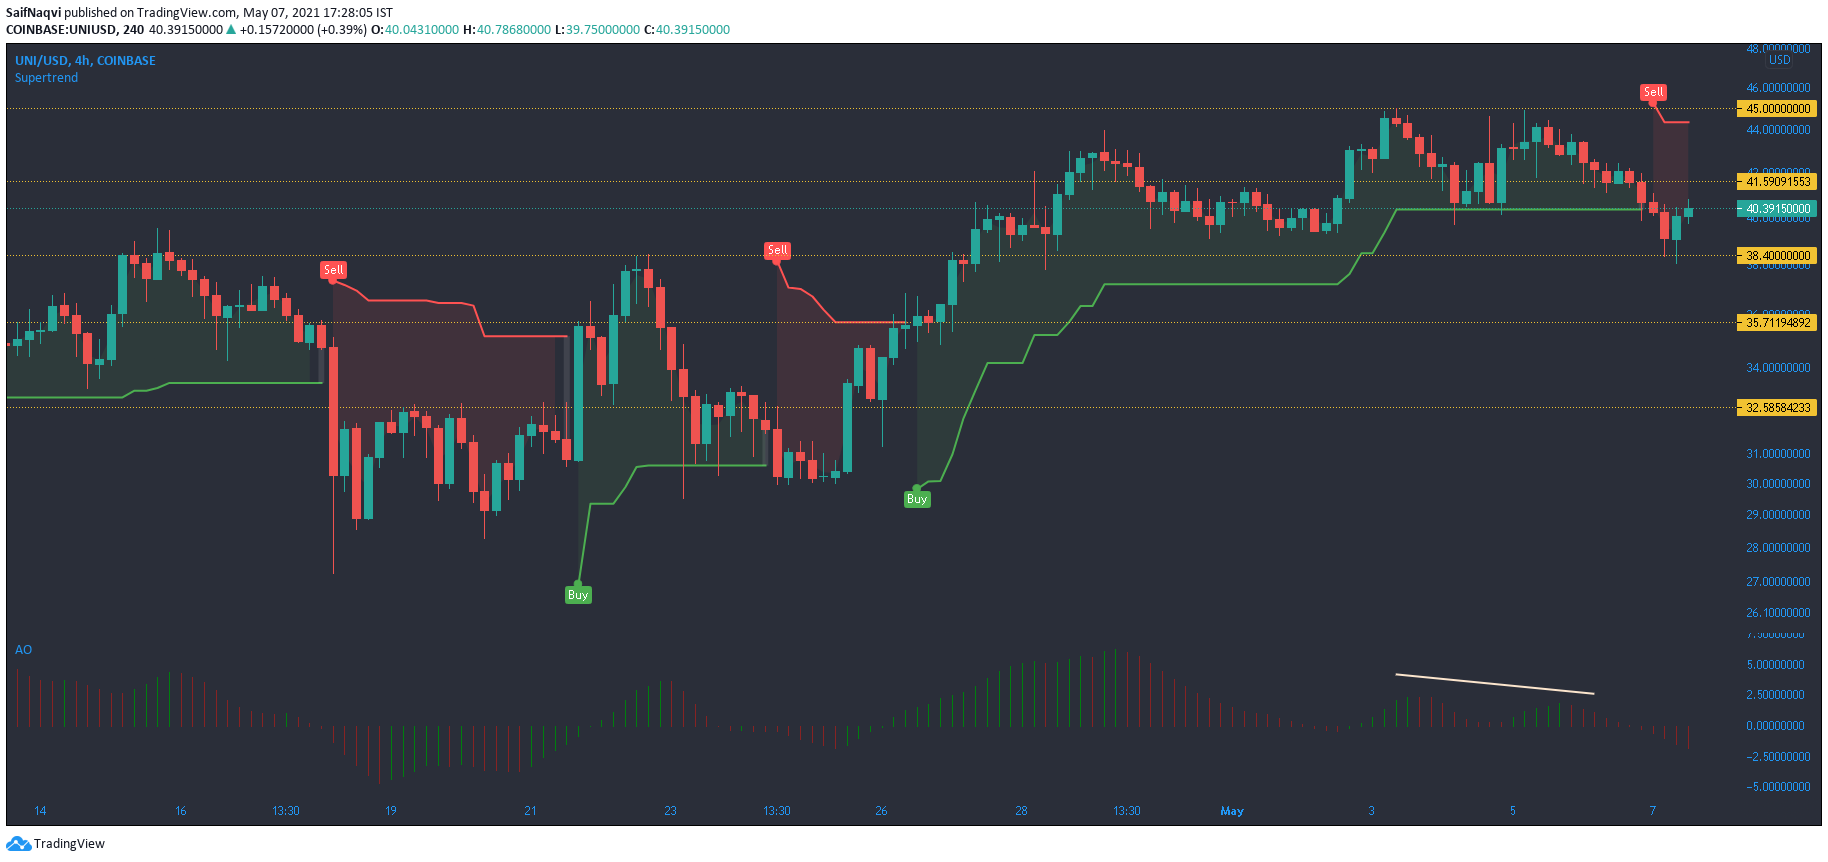
Source: UNI/USD, TradingView
Uniswap’s wavy-like movement on the 4-hour timeframe showed periods of buying pressure followed by periods of selling pressure. While buying was in effect, UNI failed to overturn $45-resistance and the price did not look ready to make this jump just yet. In fact, current market conditions reflect bearishness, and $38.4-support needed to be defended in the coming sessions.
A bearish twin peak saw Awesome Oscillator drop below the half-line as momentum rested with the sellers. Supertrend Indicator presented a sell signal with a stop loss at around $44.
Solana [SOL]
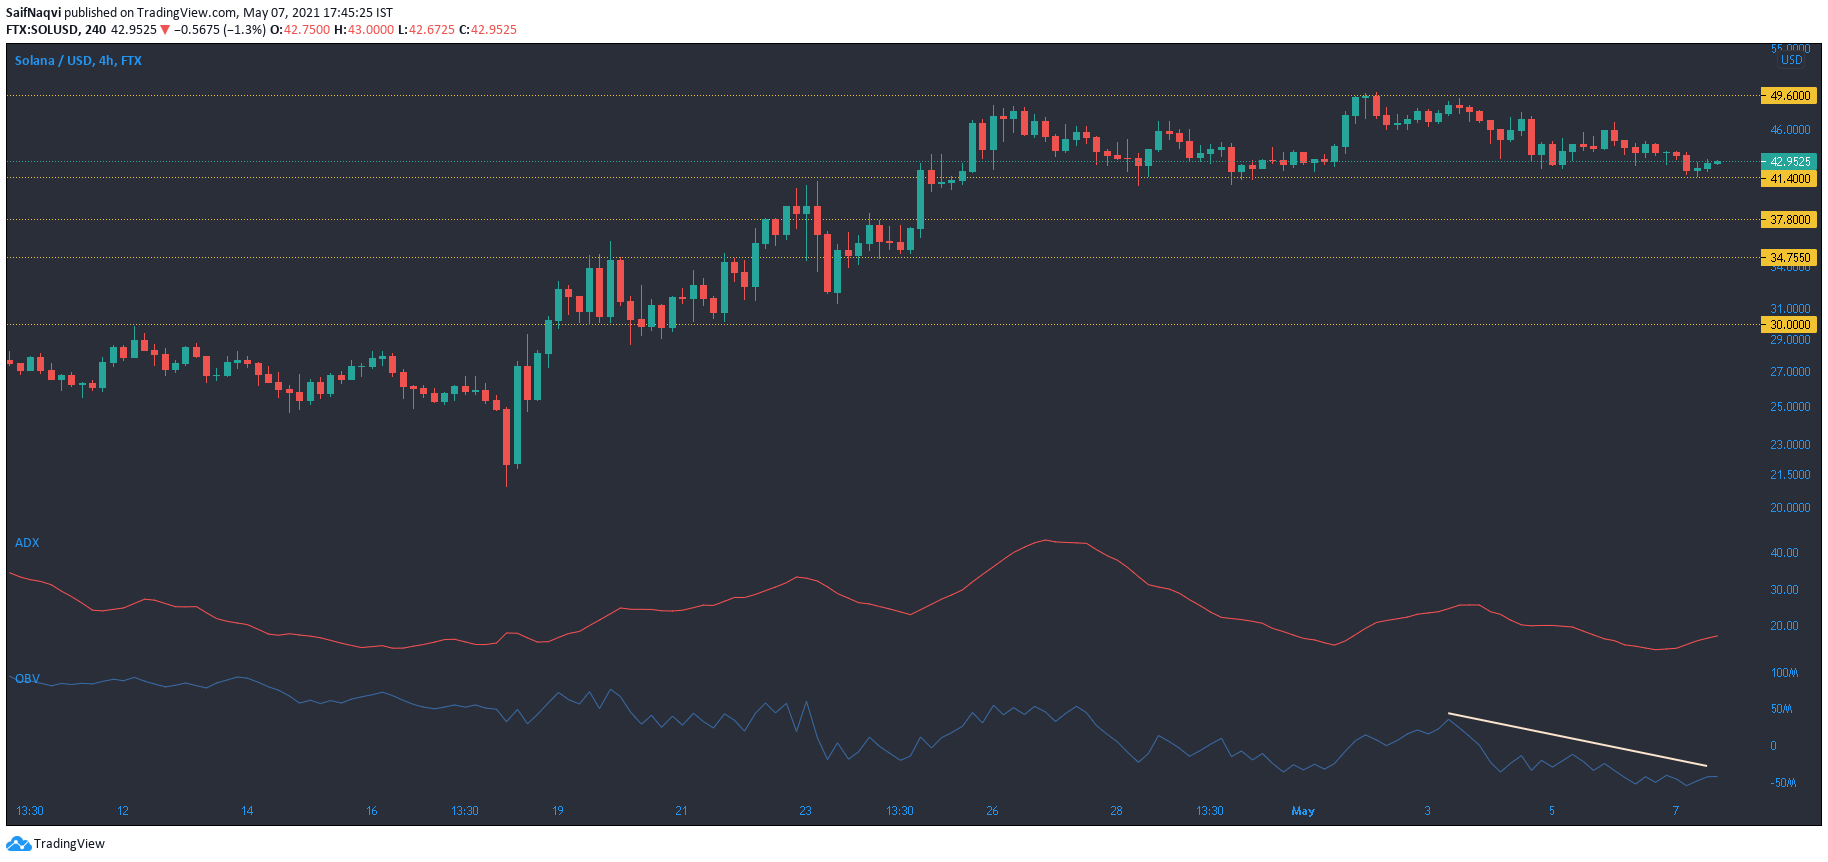
Source: SOL/USD, TradingView
An ADX reading of 17 suggested a weak trend in the Solana market as the price traded between $49.6 and $41.4. In fact, this channel was prominent over the last two weeks as neither side has been able to enforce a breakout on the charts. Trading volumes across exchanges remained muted and sharp moves were unlikely in the coming sessions.
OBV was on a steady decline since late April and the dearth of buying pressure was a worrying sign moving forward. In case of a southbound move, support areas resided at $37.8 and $34.7. A fall below the latter level could lead to a sharp sell-off all the way towards $30.