Cardano: Why ADA remains far from profitable despite the 25% value surge

- ADA logged its highest price and daily trading volume in the last two months
- However, ADA still remains an unprofitable cryptocurrency asset
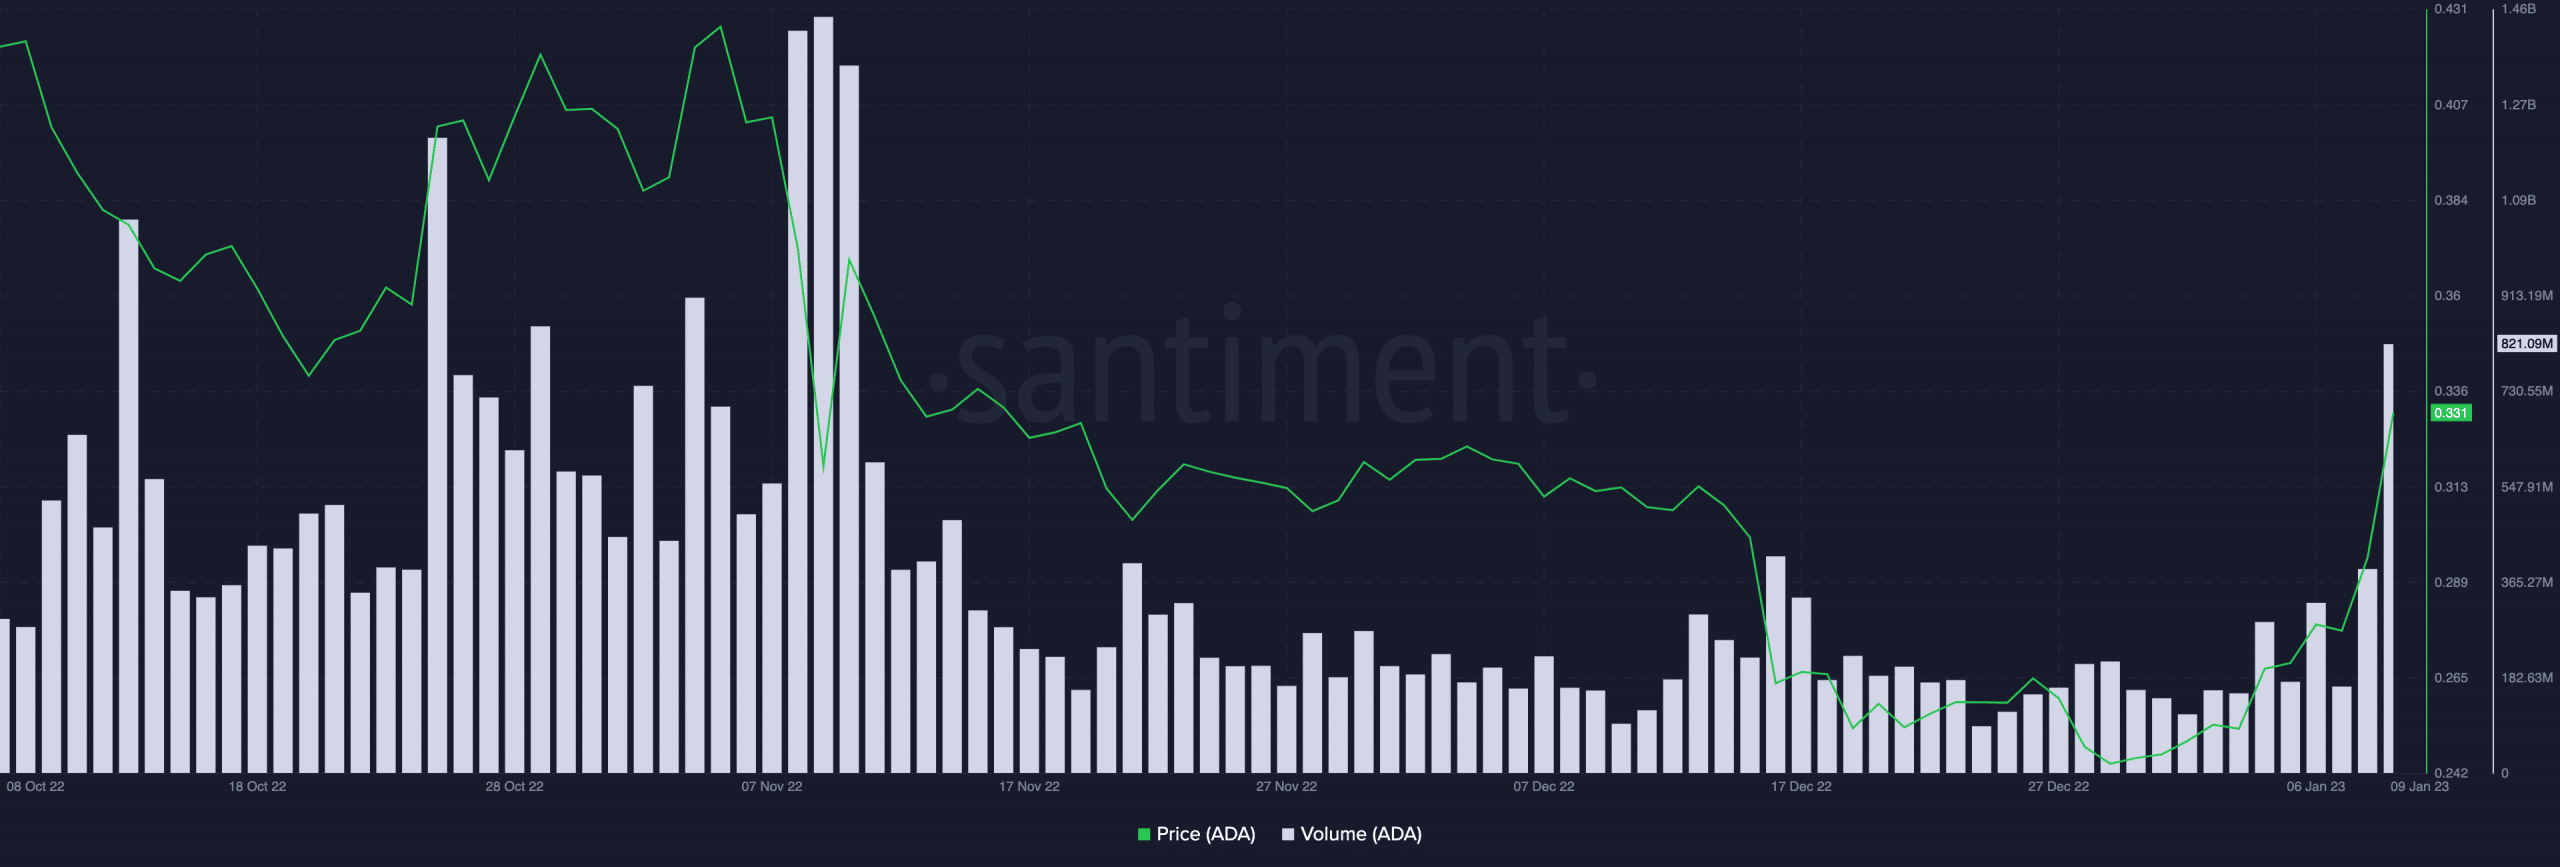
The surge in Cardano’s [ADA] trading volume in the last 24 hours pushed the price of the layer 1 coin to its mid-November levels, data from Santiment revealed.
Read Cardano’s [ADA] Price Prediction 2023-2024
Trading at $0.331 at press time, ADA exchanged hands at a price index last seen on 14 November. Furthermore, ADA tokens worth $824.41 million traded in the last 24 hours. This was the altcoin’s daily trading volume and was its highest position in the last two months.
Following a tumultuous close to the 2022 trading year, the year so far has been marked by a general recovery in the cryptocurrency ecosystem. This could be considered in the form of a growing market capitalization.
According to data from CoinGecko, in the last eight days, global cryptocurrency market capitalization increased by 4%. As of this writing, the global crypto market cap stood at $886 billion.
Impacted by the general growth in the market since 1 January, ADA’s price has since gone up by 32%. Additionally, in the last 24 hours, ADA’s value rose by almost 25%, data from CoinMarketCap revealed.

Something to look forward to here
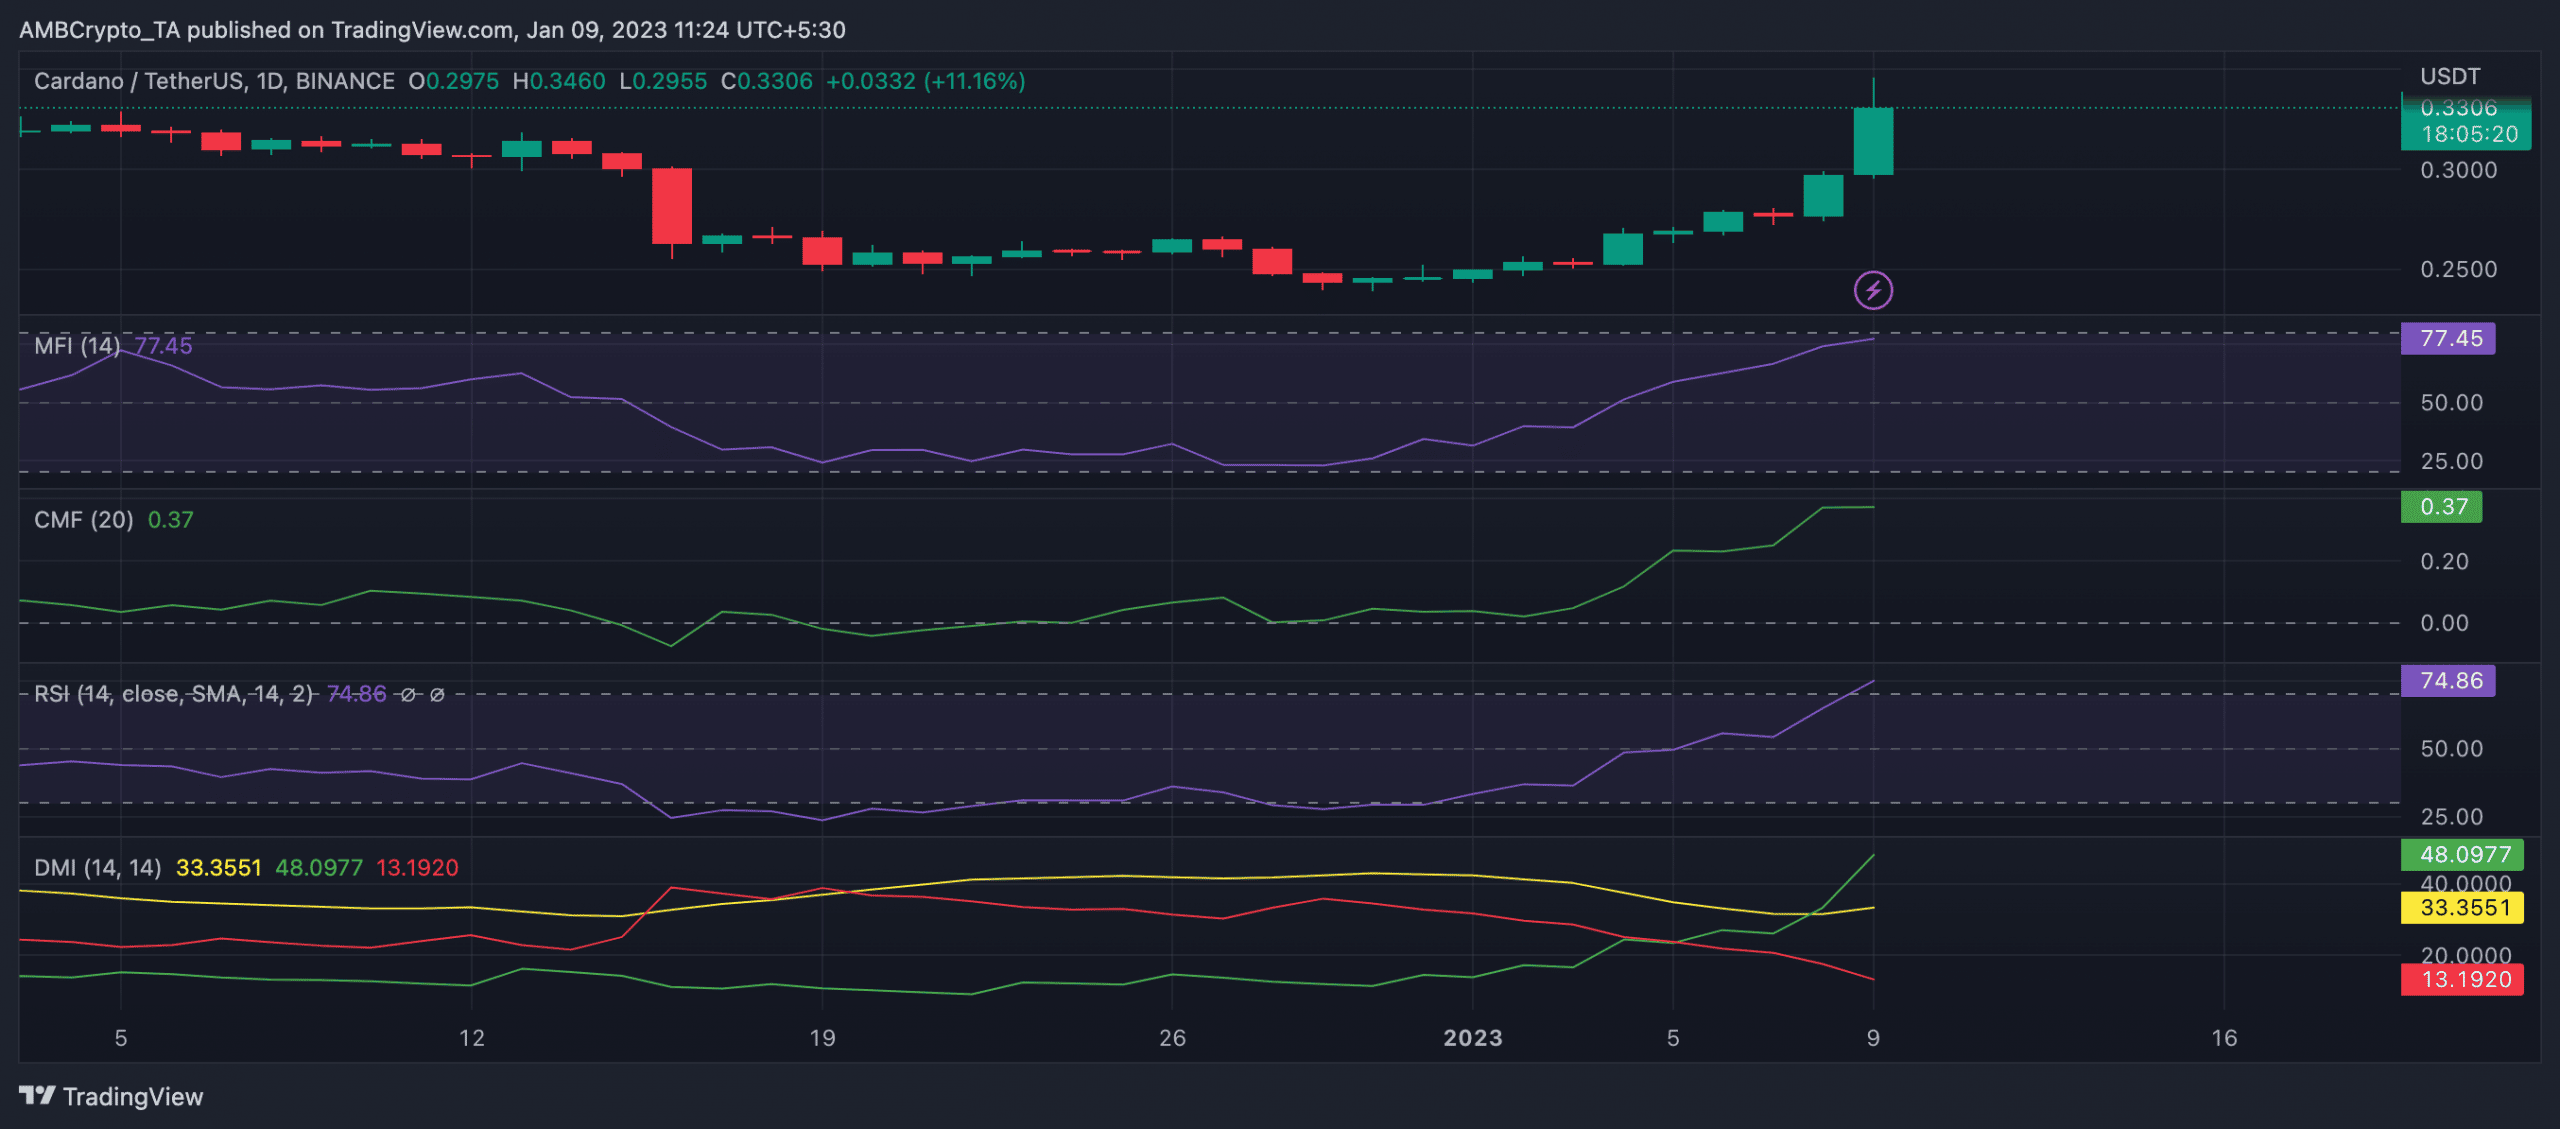
There has been an increase in the number of ADA coins being acquired over the past week. This could have contributed to the rise in its price. On a daily chart, key momentum indicators such as the Relative Strength Index (RSI) and the Money Flow Index (MFI) were positioned in uptrends close to overbought highs.
The RSI and MFI indicators have been steadily climbing in the past week, moving from below their neutral ranges to 77.45 and 74.86, respectively, at press time. It is trite that rising RSI and MFI are clear-cut indicators of increased buying pressure and bullish market conditions.
Further, the dynamic line (green) of ADA’s Chaikin Money Flow (CMF) followed a similar progression to be pegged at 0.38 at press time. Also indicative of bullish market conditions, a positive CMF suggested that the asset enjoyed increased accumulation from market participants.
At the time of writing, ADA buyers were in control of the daily market and have so been in control for the last four days. This was confirmed by the asset’s Directional Movement Index (DMI) position.
The DMI is a technical indicator that helps to identify the direction and strength of a trend in an asset’s price. At press time, ADA’s buyers’ strength rested solidly above that of the sellers as the positive directional indicator (green) laid above the negative directional indicator (green).
Are your holdings flashing green or red? Check with ADA Profit Calculator
Is there a caveat in the hiding?
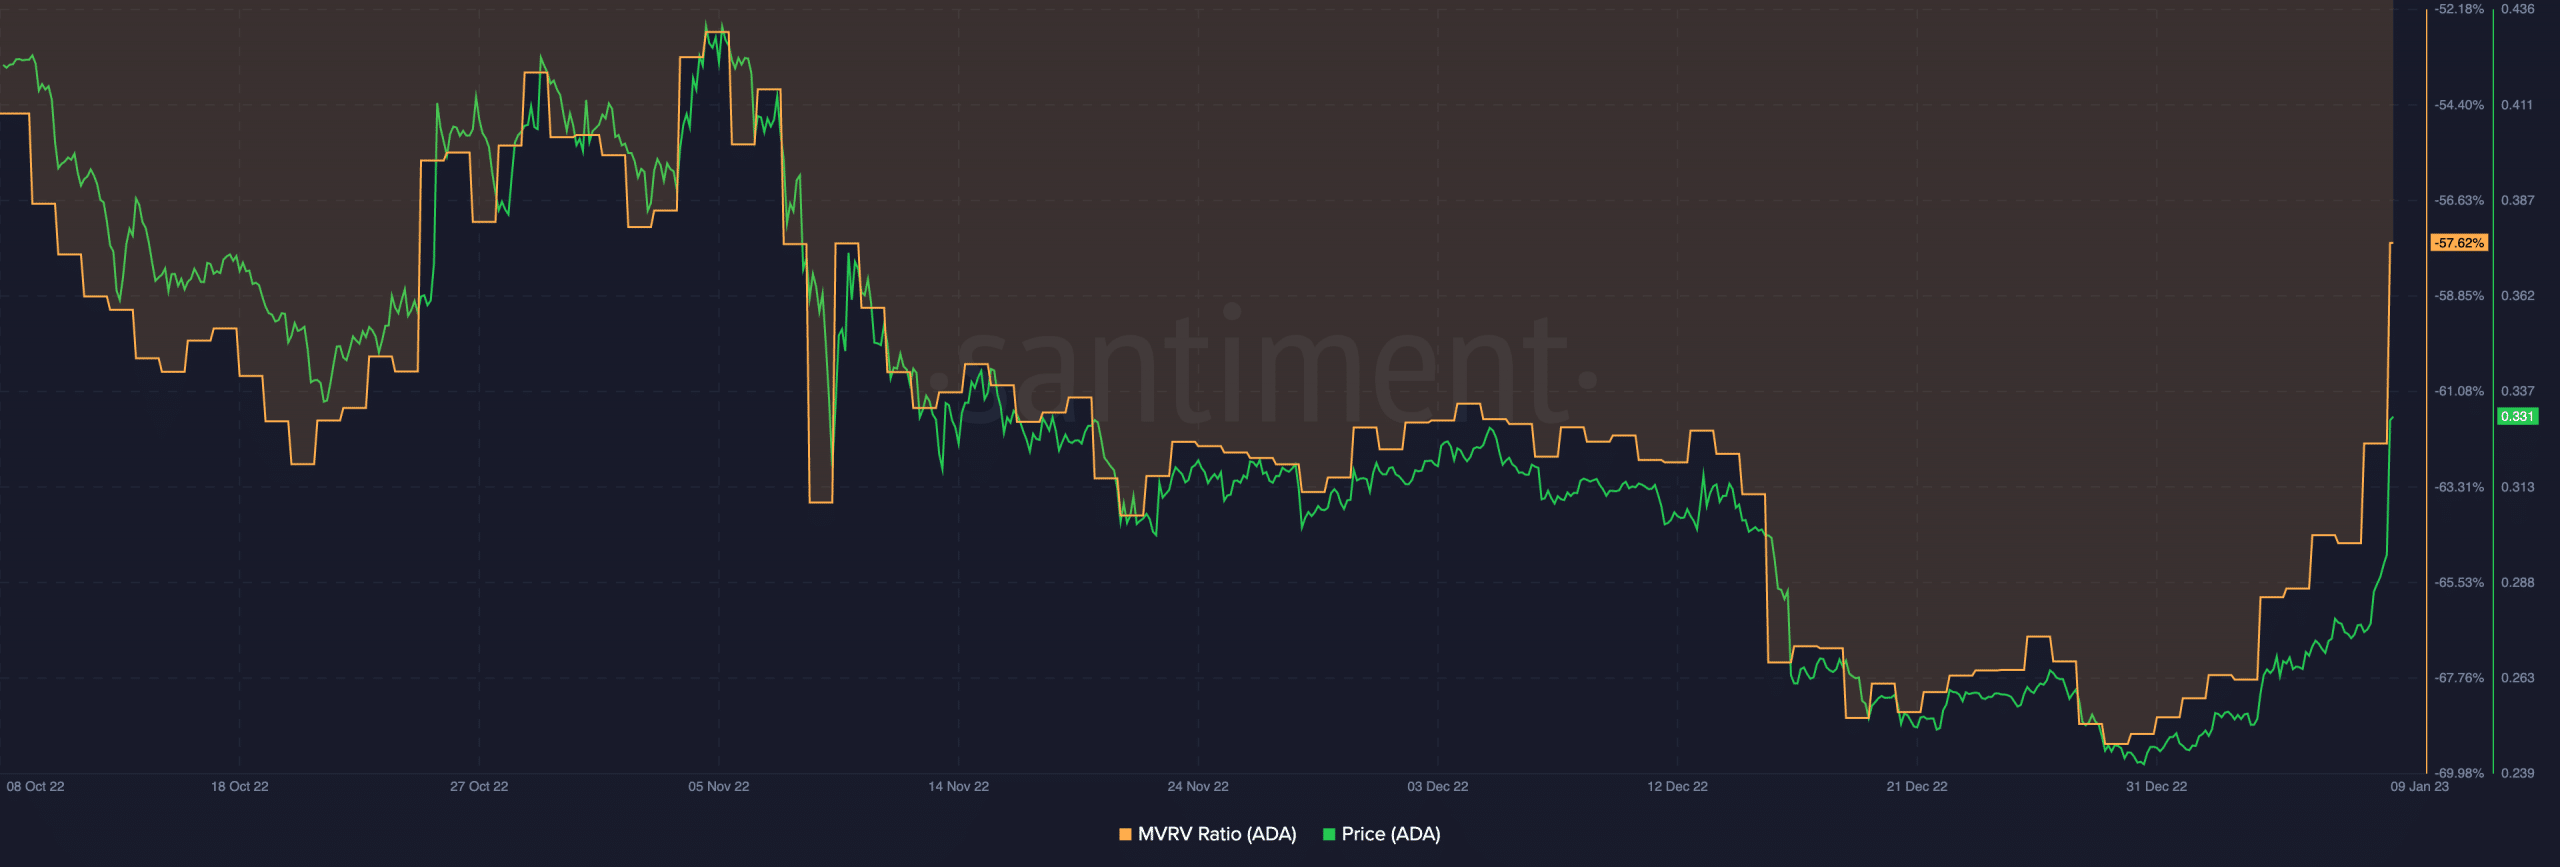
Despite the rally in price in the last week, ADA remained severely undervalued, data from Santiment showed.
In fact, it has been undervalued since April 2022 as its market-value-to-realized-value ratio (MVRV) has since been positioned below 1. This showed that most holders that sold their ADA holdings have since incurred losses. At press time, the Market Value to Realized Value (MVRV) ratio was -57.62.