
Disclaimer: The findings of the following analysis are the sole opinions of the writer and should not be taken as investment advice
Cardano regained its position as the third-largest cryptocurrency on the back of a bull flag breakout that set new records on the chart. The Fibonacci tool highlighted potential target areas in what would turn out to be an interesting week ahead if bulls are able to sustain their pressure.
At the time of writing, ADA was trading at $2.48 with a market cap of $79.38 billion. The latter was $2.5 billion higher than Binance Coin’s market cap.
Cardano Daily Chart
Source: ADA/USD, TradingView
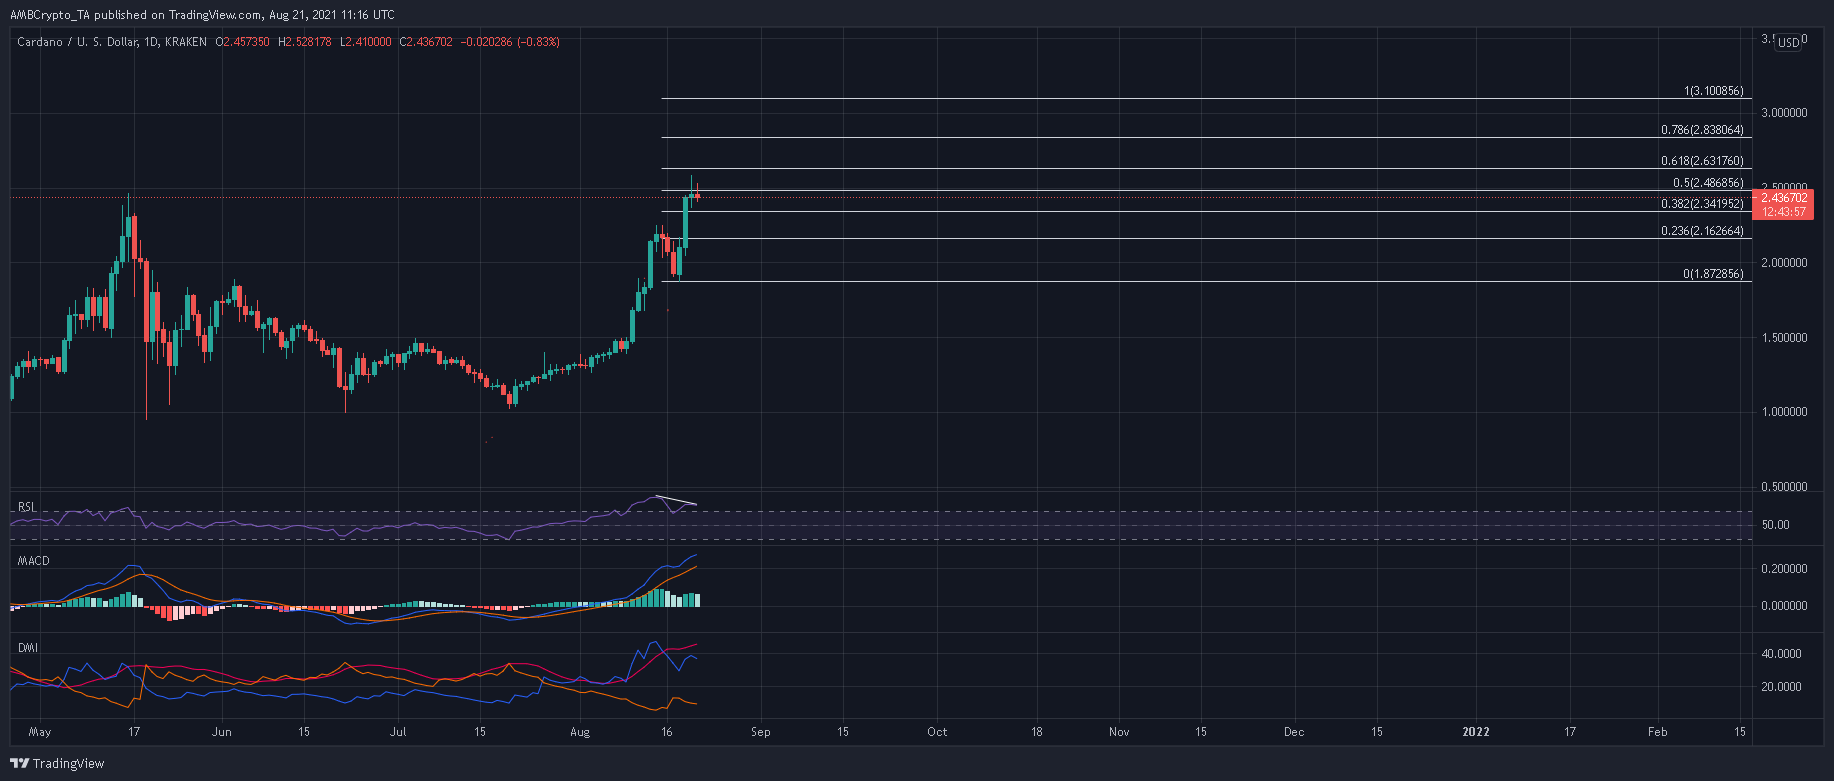
The Fibonacci tool was used on ADA’s prior retracement from $2.25 to $1.87 to plot some scenarios moving forward. Failing to close above the 50% Extension level in the next 24 hours would result in some sideways action between $2.34-$2.48 as buyers take a breather before the next upcycle.
Short sellers would be in focus in case ADA closes below the 38.2% Fibonacci level. However, take-profits are expected to be moderately placed above $2.16. The benchmark for bullish control lay at $1.87, a level from where the market would be exposed to a sharper sell-off. If these levels are sustained, the next advances lay at $2.63 and the 100% extension at the $3.1-mark.
Reasoning
Although ADA has been trading at a higher level, the Relative Strength Index did not validate this price action. The RSI formed lower peaks and highlighted a bit of a bearish divergence. The index also needed to stabilize from overbought levels.
Meanwhile, the peaks observed on the MACD’s histogram were also steady. This meant that ADA’s move towards $2.48 lacked any conviction to move to higher levels. However, the Directional Movement Index presented an overall bullish picture for ADA as the +DI traded above the -DI. This indicated that ADA’s uptrend was under no immediate threat of a reversal.
Conclusion
ADA could ease up at a lower price level before pushing north of its 50% and 61.8% Fibonacci Extension levels. A few indicators failed to move higher and presented a few near-term risks.
A doji candlestick or a spinning top would be an accurate gauge of an incoming retracement. In such a case, the price must be maintained above $1.87 to preserve ADA’s bullish thesis and an eventual hike towards the 100% Fibonacci Extension of $3.1.