
The altcoin market is once again on a downward trend with the price of most cryptocurrencies falling, at the time of writing, painting a bearish picture for the overall crypto market.
Even though the price of Bitcoin had not yet reversed, the altcoin market has seen increased bearish pressure.
Chainlink [LINK]
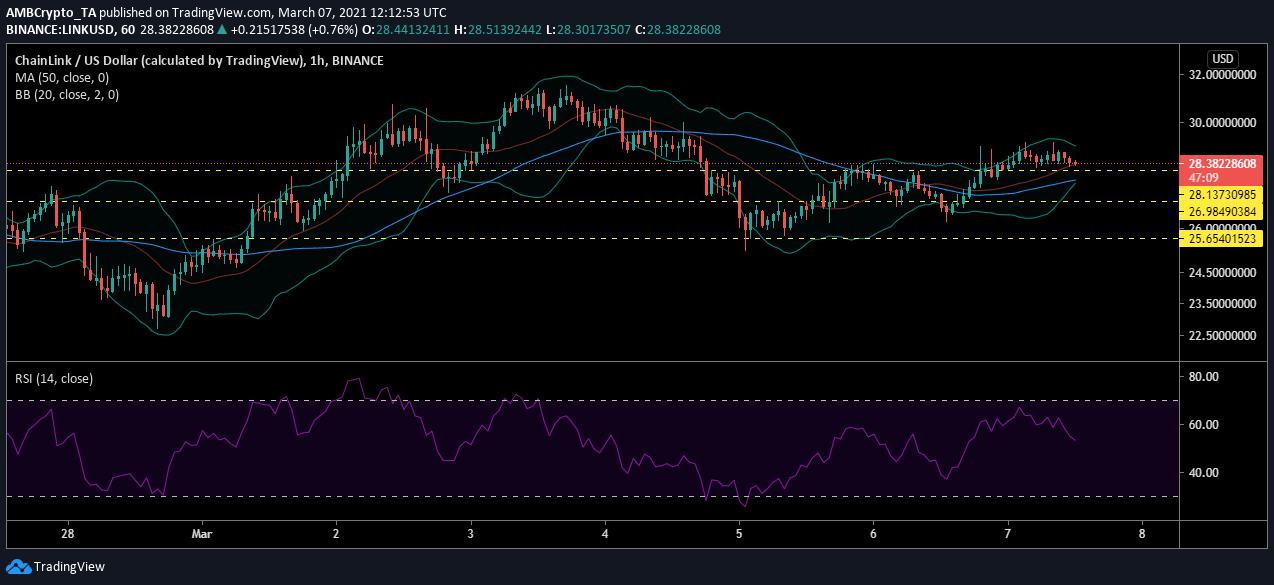
Source: LINKUSD
The LINK market highlighted that the price had climbed above the resistances and was currently hanging on to the support at $28.13. However, the selling pressure has been increasing and the price may breach this support and head lower.
This selling pressure has given way to more bearishness in the market. The Bollinger Bands were noting a gradual rise of volatility, while the signal line was above the price bars. The 50 moving average although under, was acting as a support for the falling price.
However, the relative strength index highlighted the sharp u-turn the indicator took as the price hit $29 and the sellers began selling. At the time of writing, RSI was rushing towards the oversold zone.
Aave
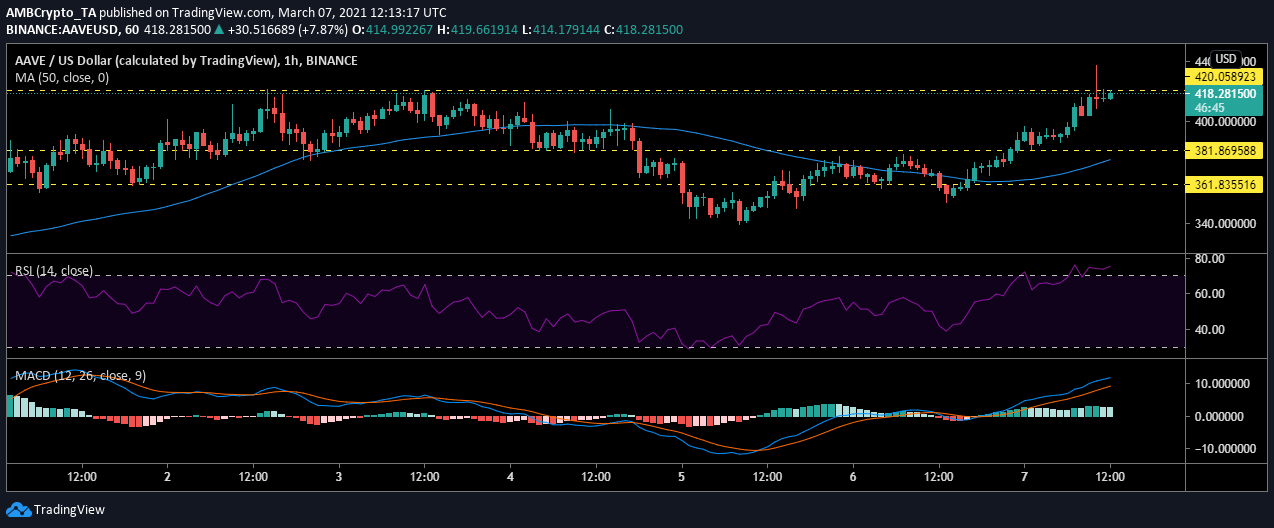
Source: AAVEUSD on TradingView
The selling pressure was introduced in the AAVE market, as the price broke down from the rising trend. As the value of the digital asset hit resistance at $420, it reversed and has been heading lower.
The RSI indicated that the rising price pushed AAVE into the overbought zone, however, as the buyers were unable to maintain this level, the price dropped. The sellers have now entered the market and the RSI was back under the overbought zone.
Whereas, the MACD indicator suggests that the AAVE market was still bullish as the MACD line remained above the signal line. However, the indicator has been inching closer towards a trend reversal.
Dash
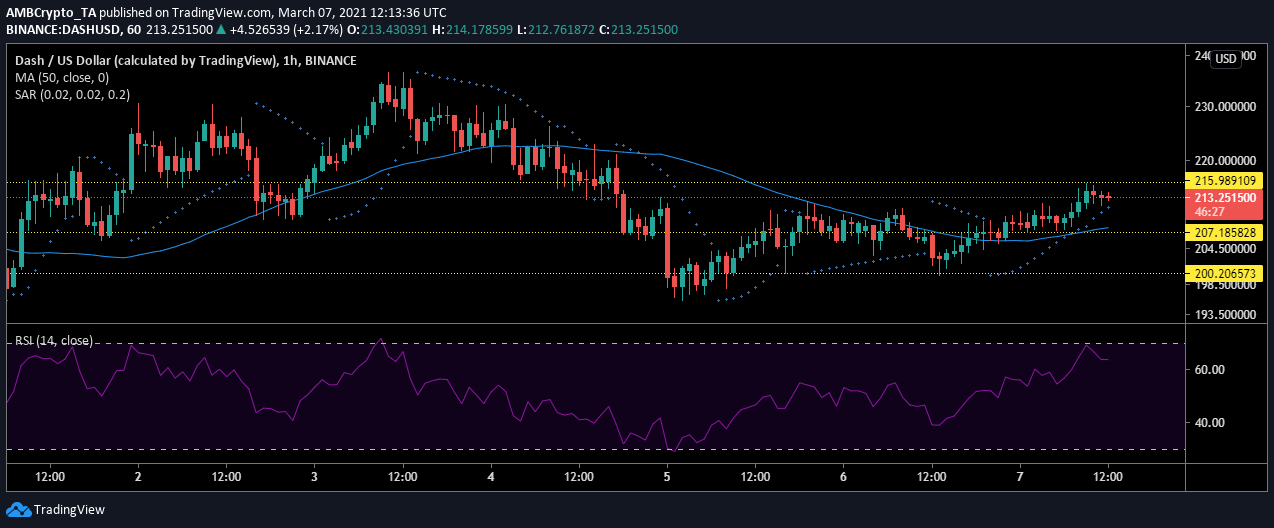
Source: DASHUSD on TradingView
The DASH market has also been painting a bearish picture, at press time. The market has begun to slide lower on the price scale as it hit resistance at $215.98. The current price was $211.96.
The digital asset is heading towards support at $207 as the sellers march in. This selling pressure was reflected in the relative strength index indicator reflecting a sharp downtrend as the asset hit the overbought zone.
The coin may continue its downtrend unless the buyers in the market decide to take charge.